Wins Number Wire Price Score Rating 52 10 10 Good Chardonay Lingha 208 32 17 Wary Good Fiveris Large Whis XD8 31 Very Good 55
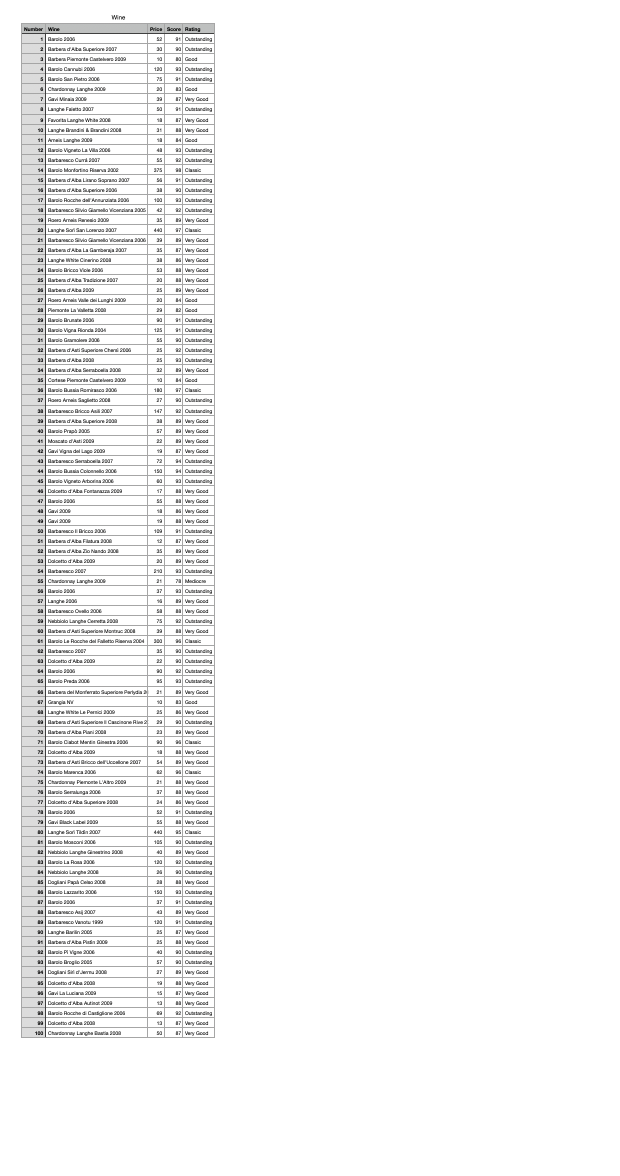
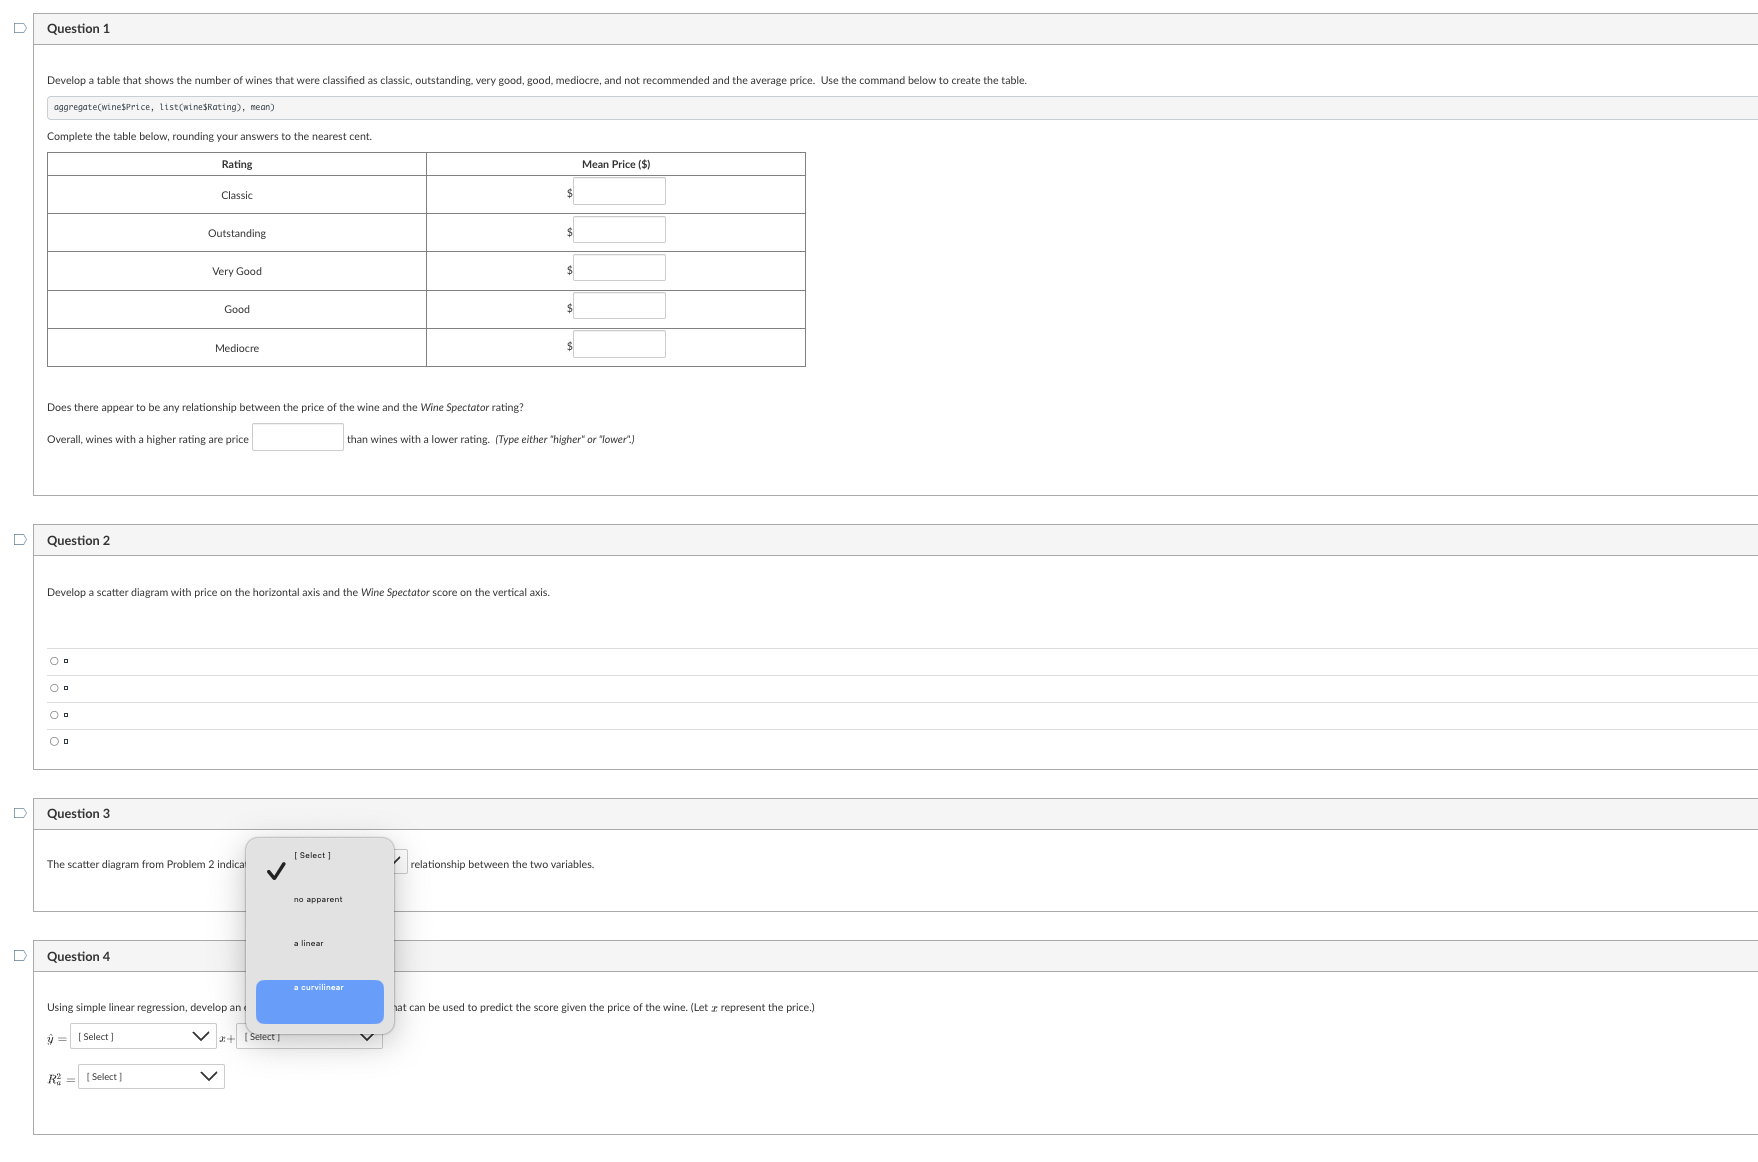
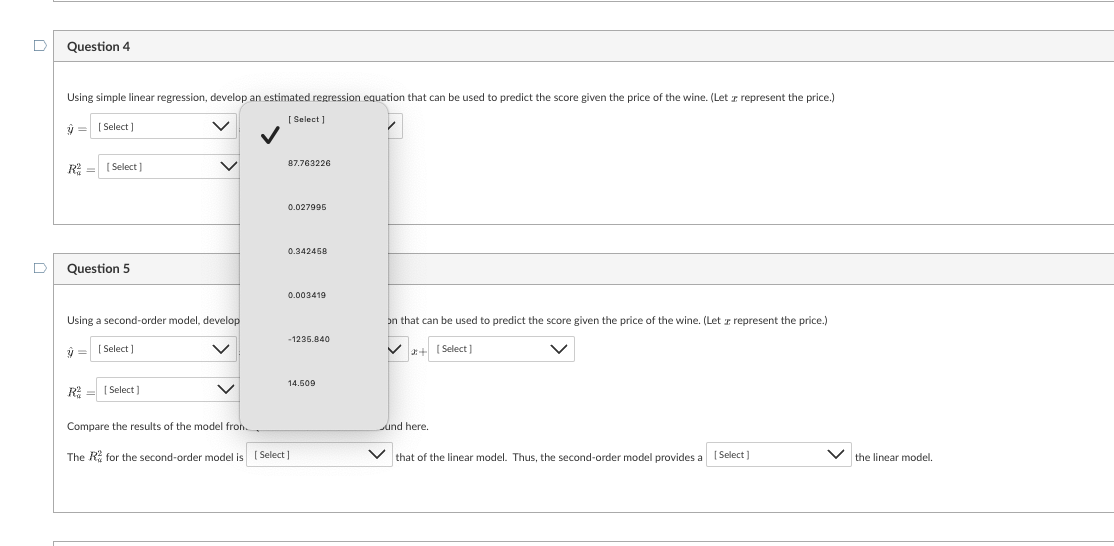
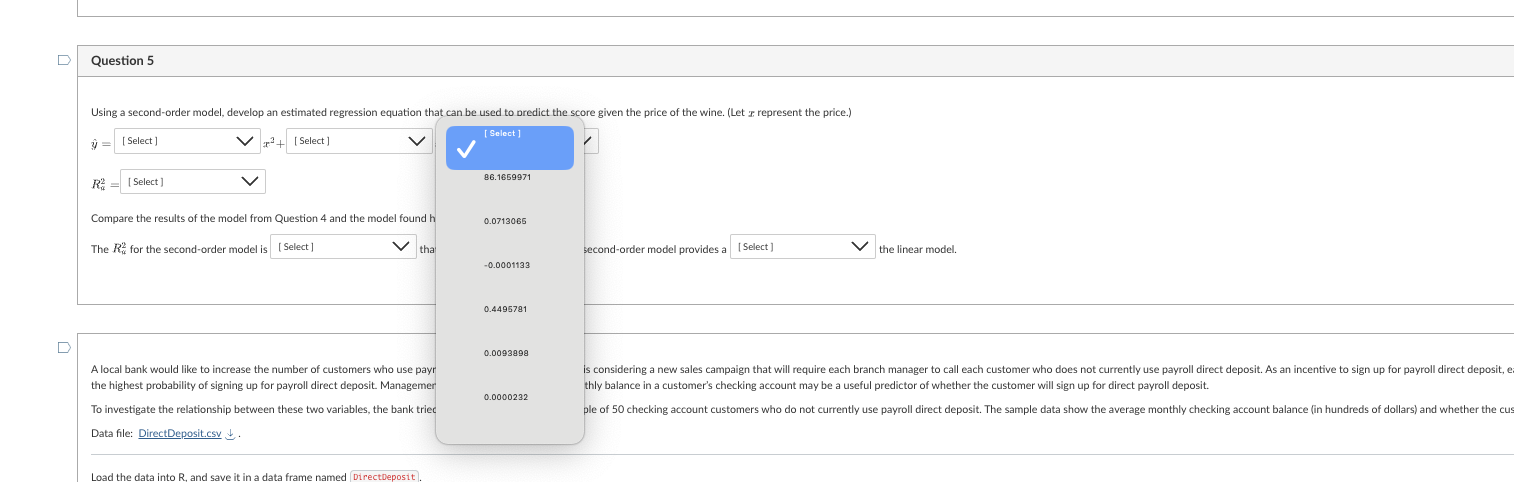
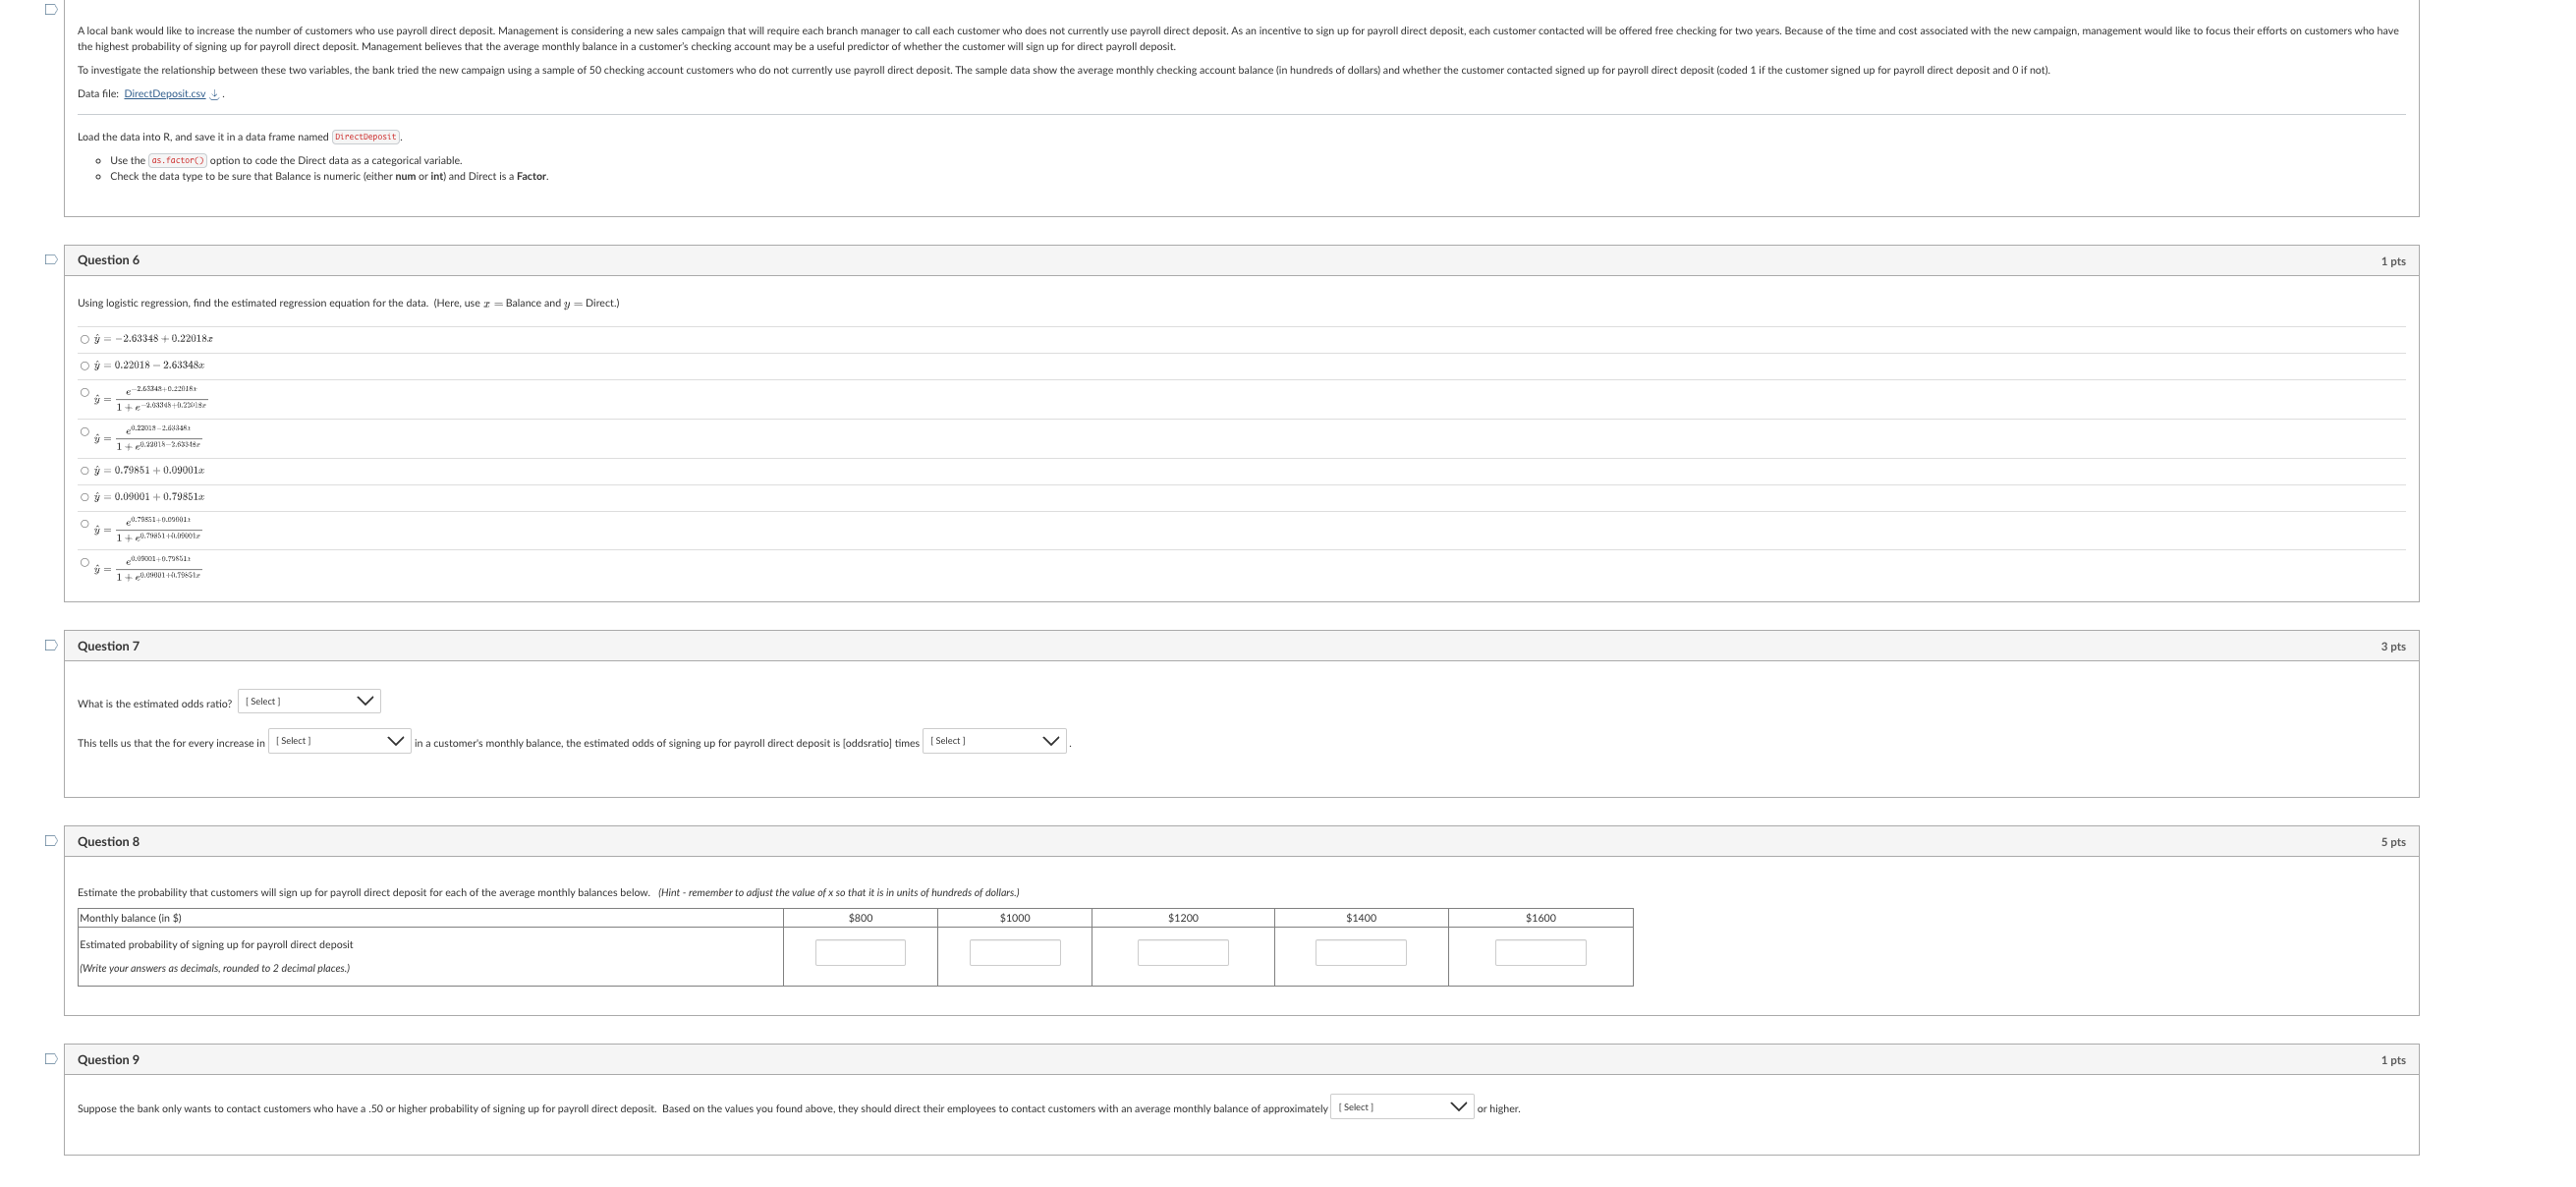
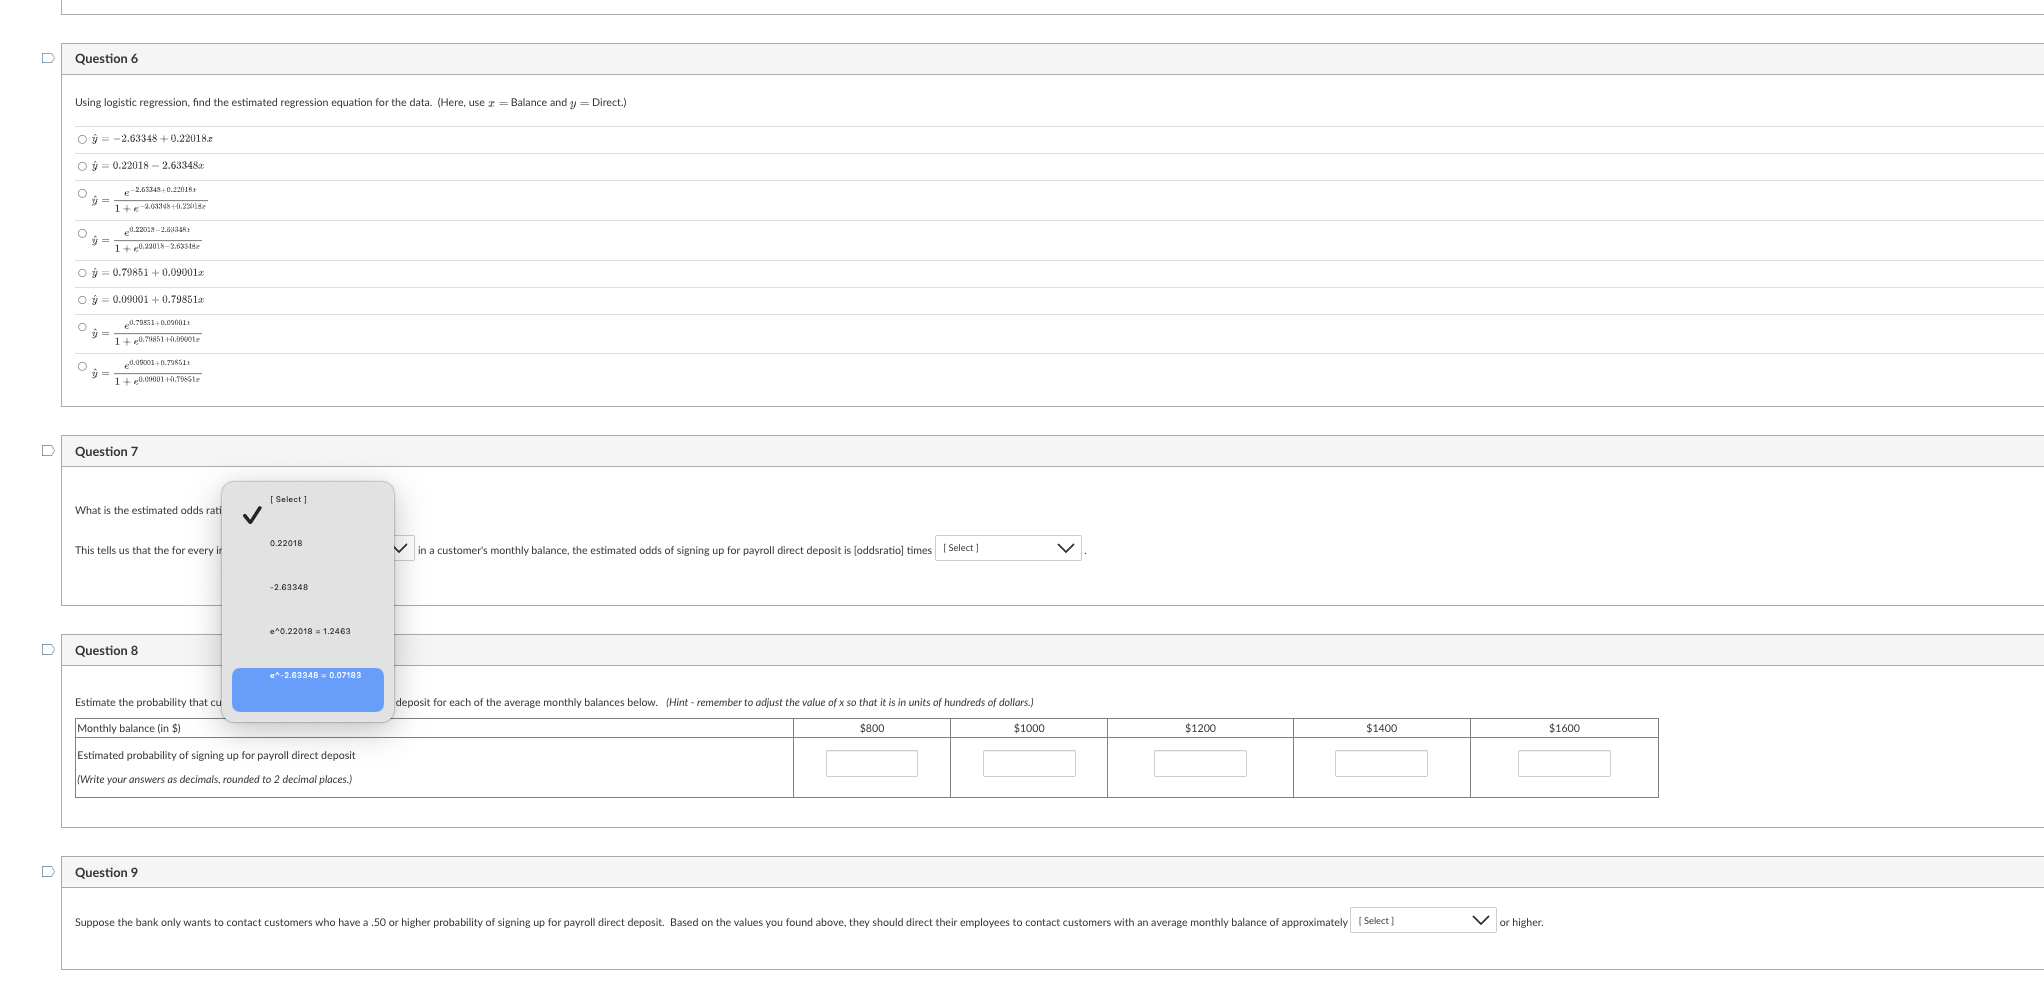
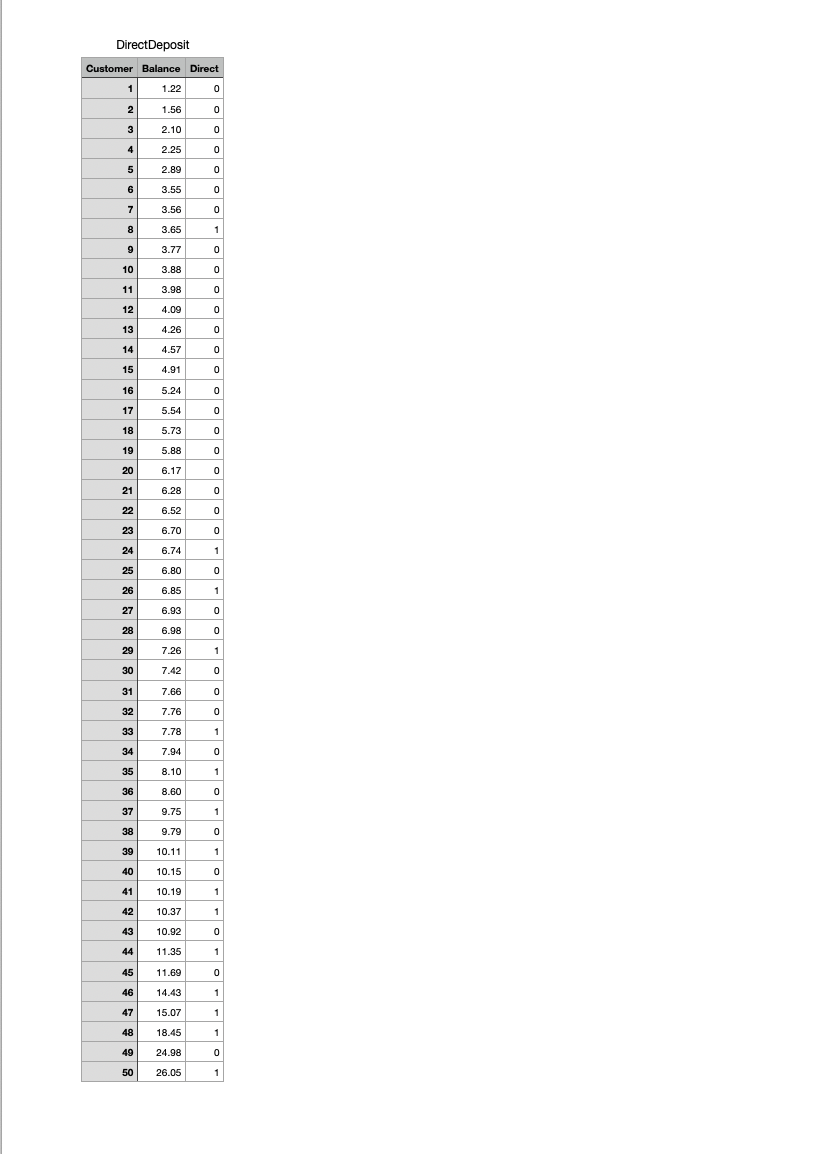
Wins Number Wire Price Score Rating 52 10 10 Good Chardonay Lingha 208 32 17 Wary Good Fiveris Large Whis XD8 31 Very Good 55 325 0 Chauic Alowreis Roccha dal Anmurciata SONG 42 35 I Very Good 440 Ha Wary Good Barbara d' Aba La Garbaraja NOT 35 17 Very Good Langhe White Cinarino S81 38 1 Wary Good 20 I Very Good 25 a Very Good Pasa Again Vile del Lunghi :1009 20 12 Gand 125 Barbara d' Asti Superices Chand 2006 25 12 19 Way Good 10 17 Chauic 17 Pasa Amain Singlotto 9004 37 10 Outstanding 147 12 Cuttinncing Alarmis Proph JOES 57 a Very Good 41 Mascots d'Asti 9069 32 Gawd Wigan dad Lage So 17 Vary Goo Butawaco Sorubella FOOT 72 150 Dolostto d Aba Fontanama S 17 I Wory Goo 55 1 Way Goo 18 1 Vary Good I Very Good 12 17 Very Good Barbara d' Aba To Nando XD1 35 Very Good Colcatto d Aba 2009 a Very Good Chardonay Langha 20 37 #3 Outstanding Langhe 5806 Vary Goo I Very Good Sa hibblola Langha Certa Modi 75 I Very Good 1 Chauic 35 Bolcatto d Abba 9009 15 Alardis Preda :2006 Barbara dal Monterrato Suppress Partyda Very Good 7 Gurga MY 10 Lange White Le Partial 2009 Way Good a Very Good * Chauic Calcatto d Ata 909 I Very Good 54 Very Good 14 Chauc I Very Good 37 I Vary Good 34 Very Good a Gawd Black Label For 55 I Wory Good a Langhe Stori Tidin 20810 440 15 Chauic 185 12 Kebbilola Langha Gineating 50 a Very Good I Wory Good 150 37 43 a Very Good H Bataviaco Vanota 1929 25 17 Vary Good H Barbara d' Aba Pain :206 I Wory Good 40 Audis Brogin 9045 57 Dagiani Sil d' Jerru N0 37 Very Good Doicatto d Alba 5008 19 I Very Good 15 17 Wary Gos 7 Colection d Abba Autinat 5004 H Alanis Rocchad Carigian 2004 a Calcatto d Aba 2000 17 Wary Good | Chardonay Langha Mastia 5030 17 Vary GoodDI Question 1 Develop a table that shows the number of wines that were classified as classic, outstanding. very good, good, mediocre, and not recommended and the average price. Use the command below to create the table. aggregate(winesPrice, list(wineskating), mean) Complete the table below, rounding your answers to the nearest cent. Rating Mean Price ($) Classic Outstanding $ Very Good Good Mediocre Does there appear to be any relationship between the price of the wine and the Wine Spectator rating? Overall, wines with a higher rating are price than wines with a lower rating. (Type either "higher" or "lower") D Question 2 Develop a scatter diagram with price on the horizontal axis and the Wine Spectator score on the vertical axis. O a O . D Question 3 The scatter diagram from Problem 2 indical [ Select ] relationship between the two variables. no apparent a linear D Question 4 a curvilinear Using simple linear regression, develop an hat can be used to predict the score given the price of the wine. (Let z represent the price.) = [ Select ] + [ Select ] R2 = [ Select ]U Question 4 g=i [ Selact | AV R2 | tseect) Question 5 Using a second-order model, devel ,;,=i_ [ Select] v 2 EI- | Select ] Compare the results of the model fro| Using simple linear regression, develop an estimated regression equation that can be used to predict the score given the price of the wine. (Let & represent the price.) \\ [ Select | I B7.763226 0.027886 0.242458 0.003413 -1236.840 14608 v] The R} for the second-order model is| [ Select] N | that of the linear madel. Thus, the secand-order model provides a | | Select ] 5n that can be used to predict the score given the price of the wine. (Let x represent the price.) N | the linear model. 'Question 5 Using 2 second-arder madel, develop an estimated regression equation that car [ [ Select | N ',1+; [ Selact ] N R: = |Select] W | 'Compare the results of the model from Question 4 and the model found h 3 i The &2 for the second-order model is [ Select ] W tha Alocal bank would like to increase the number of customers wha use pay the highest probability of signing up for payroll direct deposit. Managemer To investigate the relationship between these two variables. the bank trie Data file: DirectDepositesy 4 Load the data into R, and save it in a data frame named | Directbeposit | (B 86.1869971 0.0713085 -0.0001133 0.4405781 0.0093888 0.0000232 it the score given the price of the wine. (Let x represent the price.) = tecand-order model provides a | | Select ] N | the linear model. s considering a new sales campaign that will require each branch manager to call each customer wha does not eurrently use payroll direct deposit. As an incentive to sign up for payroll direct deposit, e: thiy balance in a custamer's checking account may be a useful predictor of whether the customer will sign up for direct payroll deposit. ple of 50 checking account customers who do not currently use payroll direct deposit. The sample data show the average monthly checking account balance (in hundreds of dollars) and whether the cus D A local bank would like to increase the number of customers who use payroll direct deposit. Management is omer who does not currently use payroll direct deposit. As an incentive to sign up for pa customer contacted will be offered free checking for two years. Because of the time and cost associated with the new campaign, management would like to focus their efforts on customers who have the highest probability of signing up for payroll direct deposit. Man To investigate the relationship between these two variables, the bank tried the new campaign using a sample of 50 checking posit. The sample data show the average monthly checking account balance (in hundreds of dollars) and whether the customer contacted signed up for payroll direct deposit (coded 1 if the customer signed up for payroll direct deposit and 0 if not). Data file: DirectDeposit.csy & . Load the data into R, and save it in a data frame named DirectDeposit . . Use the (as. factor() option to code the Direct data as a categorical variable. Check the data type to be sure that Balance is numeric (either num or int) and Direct is a Factor. D Question 6 1 pts Using logistic regression, find the estimated regression equation for the data. (Here, use z = Balance and y = Direct.) O y = -2.63348 + 0.22018.z O y = 0.22018 - 2.63348. ( 2.63348+0.22018x O # = 0.79851 + 0.090012 O = 0.09001 + 0.798512: 0 1 = 0.09001+0.798514 1 + 0.09081 +4.79651r D Question 7 3 pts What is the estimated odds ratio? [ Select ] This tells us that the for every increase in [ Select ] in a customer's monthly balance, the estimated odds of signing up for payroll direct deposit is [oddsratio] times [ Select ] D Question 8 5 pts Estimate the probability that customers will sign up for payroll direct deposit for each of the average monthly balances below. (Hint - remember to adjust the value of x so that it is in units of hundreds of dollars.) Monthly balance (in $) $800 $1000 $1200 $1400 $1600 Estimated probability of signing up for payroll direct deposit Write your answers as decimals, rounded to 2 decimal places.) D Question 9 1 pts Suppose the bank only wants to contact customers who have a .50 or higher probability of signing up for payroll direct deposit. Based on the values you found above, they should direct their employees to contact customers with an average monthly balance of approximately |[ Select ] V or higher .D A local bank would like to increase the number of customers who use payroll direct deposit. Management is omer who does not currently use payroll direct deposit. As an incentive to sign up for pa customer contacted will be offered free checking for two years. Because of the time and cost associated with the new campaign, management would like to focus their efforts on customers who have the highest probability of signing up for payroll direct deposit. Man To investigate the relationship between these two variables, the bank tried the new campaign using a sample of 50 checking posit. The sample data show the average monthly checking account balance (in hundreds of dollars) and whether the customer contacted signed up for payroll direct deposit (coded 1 if the customer signed up for payroll direct deposit and 0 if not). Data file: DirectDeposit.csy & . Load the data into R, and save it in a data frame named DirectDeposit . . Use the (as. factor() option to code the Direct data as a categorical variable. Check the data type to be sure that Balance is numeric (either num or int) and Direct is a Factor. D Question 6 1 pts Using logistic regression, find the estimated regression equation for the data. (Here, use z = Balance and y = Direct.) O y = -2.63348 + 0.22018.z O y = 0.22018 - 2.63348. ( 2.63348+0.22018x O # = 0.79851 + 0.090012 O = 0.09001 + 0.798512: 0 1 = 0.09001+0.798514 1 + 0.09081 +4.79651r D Question 7 3 pts What is the estimated odds ratio? [ Select ] This tells us that the for every increase in [ Select ] in a customer's monthly balance, the estimated odds of signing up for payroll direct deposit is [oddsratio] times [ Select ] D Question 8 5 pts Estimate the probability that customers will sign up for payroll direct deposit for each of the average monthly balances below. (Hint - remember to adjust the value of x so that it is in units of hundreds of dollars.) Monthly balance (in $) $800 $1000 $1200 $1400 $1600 Estimated probability of signing up for payroll direct deposit Write your answers as decimals, rounded to 2 decimal places.) D Question 9 1 pts Suppose the bank only wants to contact customers who have a .50 or higher probability of signing up for payroll direct deposit. Based on the values you found above, they should direct their employees to contact customers with an average monthly balance of approximately |[ Select ] V or higher .D Question 6 Using logistic regression, find the estimated regression equation for the data. (Here, use
Step by Step Solution
There are 3 Steps involved in it
Step: 1
Get Instant Access to Expert-Tailored Solutions
See step-by-step solutions with expert insights and AI powered tools for academic success
Step: 2
Step: 3
Ace Your Homework with AI
Get the answers you need in no time with our AI-driven, step-by-step assistance