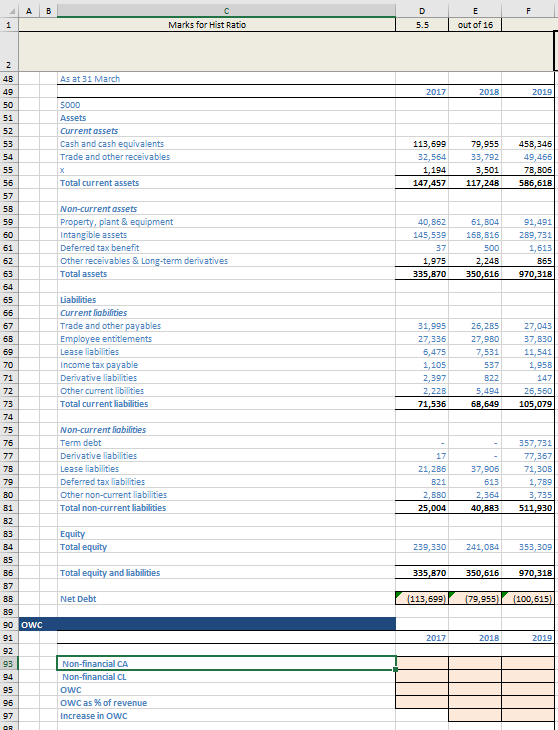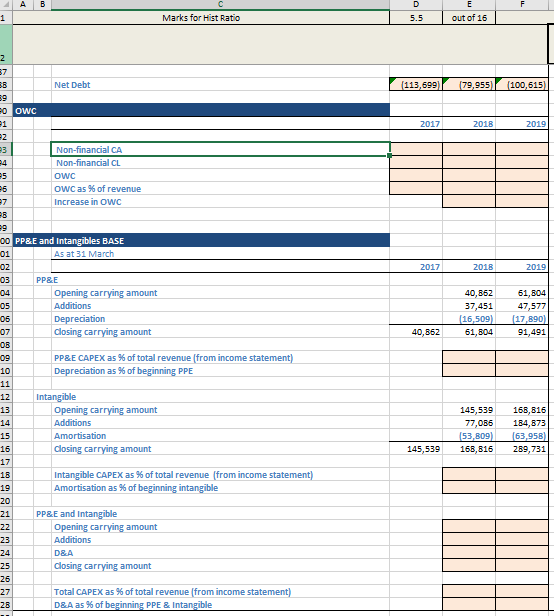
 with excel please answer the orange spaces
D F E out of 16 1 Marks for Hist Ratio 5.5 As at 31 March 2017 2018 2019 5000 Assets Current assets Cash and cash equivalents Trade and other receivables X Total current assets 113,599 32,564 1,194 147,457 79,955 33,792 3,501 117,248 458,345 49,466 78,805 586,618 Non-current assets Property, plant & equipment Intangible assets Deferred tax benefit Other receivables & Long-term derivatives Total assets 40,652 145,539 37 1,975 335,870 61,804 168,816 500 2,248 350,616 91,491 289,731 1,613 865 970,318 Liabilities Current liabilities Trade and other payables Employee entitlements Lease liabilities Income tax payable Derivative liabilities Other current libilities Total current liabilities 2 40 49 50 51 52 53 54 55 56 57 5B 59 60 61 62 63 64 65 66 67 6B 69 70 71 72 73 74 75 75 77 78 79 BO 81 B2 83 B4 85 B6 87 BB 89 90 OWC 91 92 93 94 95 96 97 31,995 27,336 6,475 1,105 2,397 2,228 71,536 26,285 27,980 7,531 537 822 5,494 68,649 27,043 37,830 11,541 1,95B 147 26,560 105,079 Non-current liabilities Term debt Derivative liabilities Lease liabilities Deferred tax liabilities Other non-current liabilities Total non-current liabilities 17 21,286 821 2,880 25,004 37,906 613 2,364 40,883 357,731 77,367 71,308 1,789 3,735 511,930 Equity Total equity 239,330 241,084 353,309 Total equity and liabilities 335,870 350,616 970,318 Net Debt (113,699) (79,955) (100,615) 2017 2018 2019 Non-financial CA Non-financial CL OWC Owc as % of revenue Increase in OWC A B D 5.5 E out of 16 1 Marks for Hist Ratio 2 $7 Net Debt (113,699) (79,955) (100,615 2017 2018 2019 2017 2018 2019 40,852 37,451 16,509) 61,804 61,604 47,577 17,890) 91,491 40,862 O OWC 21 2 e3 Non-financial CA Non-financial CL 25 OWC 25 OwC as % of revenue 97 Increase in Owc B 29 00 PP&E and Intangibles BASE 01 As at 31 March 02 03 PP&E 04 Opening carrying amount 05 Additions 06 Depreciation 07 closing carrying amount OB 09 PP&E CAPEX as % of total revenue (from income statement) 10 Depreciation as % of beginning PPE 11 12 Intangible 13 Opening carrying amount 14 Additions 15 Amortisation 16 closing carrying amount 17 1B Intangible CAPEX as % of total revenue (from income statement) 19 Amortisation as % of beginning intangible 20 21 PP&E and Intangible 22 Opening carrying amount 23 Additions 24 D&A 25 closing carrying amount 26 27 Total CAPEX as % of total revenue (from income statement) 2B D&A as % of beginning PPE & Intangible 145,539 77,086 53,809) 168,816 168,816 184,873 (63,958) 289,731 145,539 D F E out of 16 1 Marks for Hist Ratio 5.5 As at 31 March 2017 2018 2019 5000 Assets Current assets Cash and cash equivalents Trade and other receivables X Total current assets 113,599 32,564 1,194 147,457 79,955 33,792 3,501 117,248 458,345 49,466 78,805 586,618 Non-current assets Property, plant & equipment Intangible assets Deferred tax benefit Other receivables & Long-term derivatives Total assets 40,652 145,539 37 1,975 335,870 61,804 168,816 500 2,248 350,616 91,491 289,731 1,613 865 970,318 Liabilities Current liabilities Trade and other payables Employee entitlements Lease liabilities Income tax payable Derivative liabilities Other current libilities Total current liabilities 2 40 49 50 51 52 53 54 55 56 57 5B 59 60 61 62 63 64 65 66 67 6B 69 70 71 72 73 74 75 75 77 78 79 BO 81 B2 83 B4 85 B6 87 BB 89 90 OWC 91 92 93 94 95 96 97 31,995 27,336 6,475 1,105 2,397 2,228 71,536 26,285 27,980 7,531 537 822 5,494 68,649 27,043 37,830 11,541 1,95B 147 26,560 105,079 Non-current liabilities Term debt Derivative liabilities Lease liabilities Deferred tax liabilities Other non-current liabilities Total non-current liabilities 17 21,286 821 2,880 25,004 37,906 613 2,364 40,883 357,731 77,367 71,308 1,789 3,735 511,930 Equity Total equity 239,330 241,084 353,309 Total equity and liabilities 335,870 350,616 970,318 Net Debt (113,699) (79,955) (100,615) 2017 2018 2019 Non-financial CA Non-financial CL OWC Owc as % of revenue Increase in OWC A B D 5.5 E out of 16 1 Marks for Hist Ratio 2 $7 Net Debt (113,699) (79,955) (100,615 2017 2018 2019 2017 2018 2019 40,852 37,451 16,509) 61,804 61,604 47,577 17,890) 91,491 40,862 O OWC 21 2 e3 Non-financial CA Non-financial CL 25 OWC 25 OwC as % of revenue 97 Increase in Owc B 29 00 PP&E and Intangibles BASE 01 As at 31 March 02 03 PP&E 04 Opening carrying amount 05 Additions 06 Depreciation 07 closing carrying amount OB 09 PP&E CAPEX as % of total revenue (from income statement) 10 Depreciation as % of beginning PPE 11 12 Intangible 13 Opening carrying amount 14 Additions 15 Amortisation 16 closing carrying amount 17 1B Intangible CAPEX as % of total revenue (from income statement) 19 Amortisation as % of beginning intangible 20 21 PP&E and Intangible 22 Opening carrying amount 23 Additions 24 D&A 25 closing carrying amount 26 27 Total CAPEX as % of total revenue (from income statement) 2B D&A as % of beginning PPE & Intangible 145,539 77,086 53,809) 168,816 168,816 184,873 (63,958) 289,731 145,539

 with excel please answer the orange spaces


