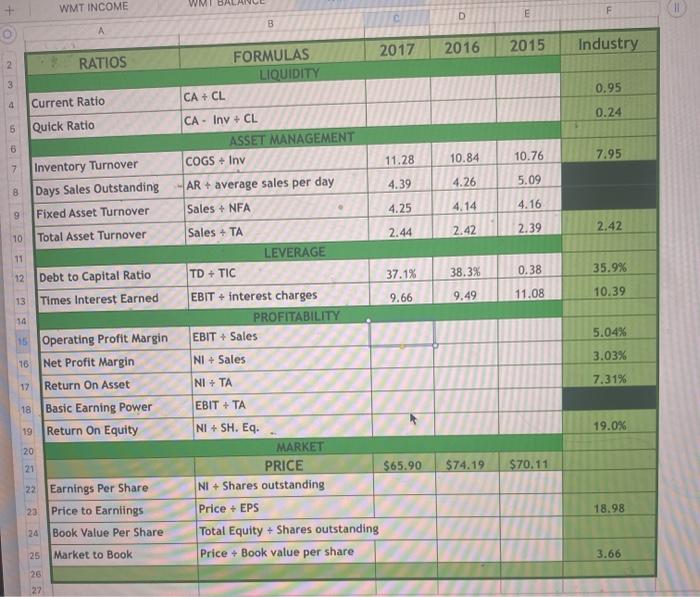
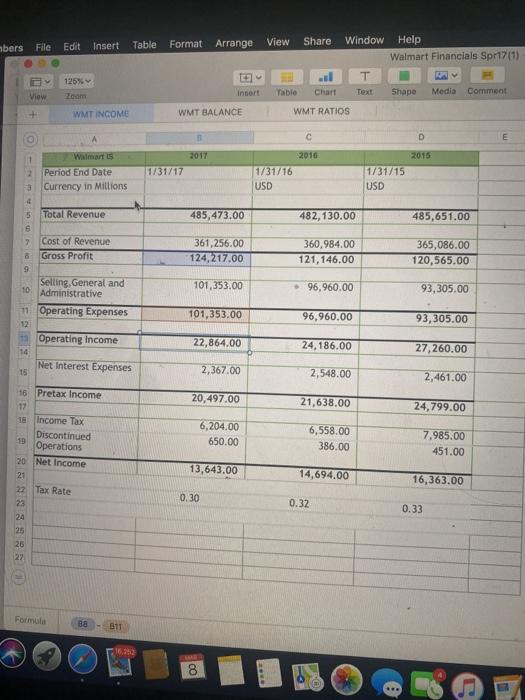
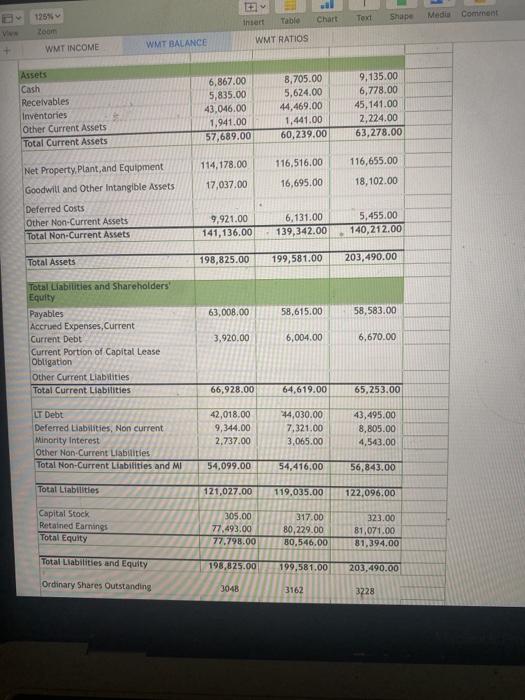
WMT INCOME WMI E F D B 2017 2016 2015 Industry RATIOS FORMULAS LIQUIDITY 3 0.95 4 Current Ratio CA + CL 0.24 5 Quick Ratio CA - Inv + CL ASSET MANAGEMENT COGS + Inv 6 11.28 10.84 7.95 10.76 4.39 4.26 5.09 7 Inventory Turnover 8 Days Sales Outstanding Fixed Asset Turnover 10 Total Asset Turnover -AR + average sales per day Sales + NFA 4.25 4.14 4.16 Sales + TA 2.44 2.42 2.42 2.39 LEVERAGE 11 TD + TIC 37.1% 38.3% 0.38 35.9% 13 11.08 10.39 9.66 9.49 12 Debt to Capital Ratio Times Interest Earned 14 1s Operating Profit Margin Net Profit Margin EBIT + interest charges PROFITABILITY EBIT + Sales 5.04% 16 3.03% NI + Sales 17 7.31% Return On Asset NI + TA 18 Basic Earning Power Return On Equity 19 19.0% 20 21 $74.19 $70.11 EBIT + TA NI + SH. Eq. MARKET PRICE $65.90 NI + Shares outstanding Price + EPS Total Equity + Shares outstanding Price + Book value per share 22 Earnings Per Share 23 Price to Earnings 24 Book Value Per Share 18.98 25 Market to Book 3.66 26 27 Table Share bers File Window Edit Format Insert Arrange View Help Walmart Financials Spr17(1) 125% Zoom T Text . Tablo Chart WMT RATIOS Insert View Media Shape Comment + WMT INCOME WMT BALANCE A D 2017 2016 1/31/17 1/31/16 USD 2015 1/31/15 USD 485,473.00 482,130.00 485,651.00 1 Walmart is 2 Period End Date Currency in Millions 4 5 Total Revenue 6 2 Cost of Revenue Gross Profit 9 Selling, General and 10 Administrative 11 Operating Expenses 12 12 Operating Income 14 Net Interest Expenses 15 361,256.00 124,217.00 360,984.00 121, 146.00 365,086.00 120,565.00 101,353.00 96,960.00 93,305.00 101,353.00 96,960.00 93,305.00 22,864.00 24,186.00 27,260.00 2,367.00 2,548.00 2,461.00 20,497.00 21,638.00 24,799.00 16 Pretax Income 17 18 Income Tax Discontinued 19 Operations 20 Net Income 21 22 Tax Rate 6,204.00 650.00 6,558.00 386.00 7,985.00 451.00 13,643.00 14,694.00 16,363.00 0.30 0.32 23 24 0.33 26 Formal - B11 10,22 Text Media Shape Comment 125 zoom Table ihtert Chart WMT BALANCE WMT RATIOS WMT INCOME + Assets Cash Receivables Inventories Other Current Assets Total Current Assets 6,867.00 5,835.00 43.046.00 1,941.00 57,689.00 B.705.00 5,624.00 44,469.00 1,441.00 60,239.00 9,135.00 6,778.00 45, 141.00 2,224.00 63,278.00 116,516.00 114,178.00 17.037.00 116,655.00 18, 102.00 16,695.00 Net Property, plant and Equipment Goodwill and Other intangible Assets Deferred Costs Other Non-Current Assets Total Non-Current Assets . 9,921.00 141,136.00 6,131.00 139,342.00 5,455.00 140,212.00 Total Assets 198,825.00 199,581.00 203,490.00 63,000.00 58,615.00 58,583.00 Total Liabilities and Shareholders' Equity Payables Accrued Expenses, Current Current Debt Current Portion of Capital Lease Obligation Other Current Liabilities Total Current Liabilities 3,920.00 6,004.00 6,670.00 66,928.00 64,619.00 65,253.00 LT Debt Deferred Liabilities, Non current Minority interest Other Non-Current Liabilities Total Non-Current Liabilities and MI 42,018.00 9,344.00 2.737.00 44,030.00 7,321.00 3,065.00 43,495.00 8,805.00 4,543.00 54,099.00 54,416,00 56,843.00 Total Liabilities 121,027.00 119,035.00 122,096.00 Capital Stock Retained Earnings Total Equity 305.00 77.493.00 77.798.00 317.00 80,229.00 30,546,00 323.00 81,071.00 81,394,00 Total Liabilities and Equity 198,825.00 199,581.00 203,490.00 Ordinary Shares Outstanding 3048 3162 3228 WMT INCOME WMI E F D B 2017 2016 2015 Industry RATIOS FORMULAS LIQUIDITY 3 0.95 4 Current Ratio CA + CL 0.24 5 Quick Ratio CA - Inv + CL ASSET MANAGEMENT COGS + Inv 6 11.28 10.84 7.95 10.76 4.39 4.26 5.09 7 Inventory Turnover 8 Days Sales Outstanding Fixed Asset Turnover 10 Total Asset Turnover -AR + average sales per day Sales + NFA 4.25 4.14 4.16 Sales + TA 2.44 2.42 2.42 2.39 LEVERAGE 11 TD + TIC 37.1% 38.3% 0.38 35.9% 13 11.08 10.39 9.66 9.49 12 Debt to Capital Ratio Times Interest Earned 14 1s Operating Profit Margin Net Profit Margin EBIT + interest charges PROFITABILITY EBIT + Sales 5.04% 16 3.03% NI + Sales 17 7.31% Return On Asset NI + TA 18 Basic Earning Power Return On Equity 19 19.0% 20 21 $74.19 $70.11 EBIT + TA NI + SH. Eq. MARKET PRICE $65.90 NI + Shares outstanding Price + EPS Total Equity + Shares outstanding Price + Book value per share 22 Earnings Per Share 23 Price to Earnings 24 Book Value Per Share 18.98 25 Market to Book 3.66 26 27 Table Share bers File Window Edit Format Insert Arrange View Help Walmart Financials Spr17(1) 125% Zoom T Text . Tablo Chart WMT RATIOS Insert View Media Shape Comment + WMT INCOME WMT BALANCE A D 2017 2016 1/31/17 1/31/16 USD 2015 1/31/15 USD 485,473.00 482,130.00 485,651.00 1 Walmart is 2 Period End Date Currency in Millions 4 5 Total Revenue 6 2 Cost of Revenue Gross Profit 9 Selling, General and 10 Administrative 11 Operating Expenses 12 12 Operating Income 14 Net Interest Expenses 15 361,256.00 124,217.00 360,984.00 121, 146.00 365,086.00 120,565.00 101,353.00 96,960.00 93,305.00 101,353.00 96,960.00 93,305.00 22,864.00 24,186.00 27,260.00 2,367.00 2,548.00 2,461.00 20,497.00 21,638.00 24,799.00 16 Pretax Income 17 18 Income Tax Discontinued 19 Operations 20 Net Income 21 22 Tax Rate 6,204.00 650.00 6,558.00 386.00 7,985.00 451.00 13,643.00 14,694.00 16,363.00 0.30 0.32 23 24 0.33 26 Formal - B11 10,22 Text Media Shape Comment 125 zoom Table ihtert Chart WMT BALANCE WMT RATIOS WMT INCOME + Assets Cash Receivables Inventories Other Current Assets Total Current Assets 6,867.00 5,835.00 43.046.00 1,941.00 57,689.00 B.705.00 5,624.00 44,469.00 1,441.00 60,239.00 9,135.00 6,778.00 45, 141.00 2,224.00 63,278.00 116,516.00 114,178.00 17.037.00 116,655.00 18, 102.00 16,695.00 Net Property, plant and Equipment Goodwill and Other intangible Assets Deferred Costs Other Non-Current Assets Total Non-Current Assets . 9,921.00 141,136.00 6,131.00 139,342.00 5,455.00 140,212.00 Total Assets 198,825.00 199,581.00 203,490.00 63,000.00 58,615.00 58,583.00 Total Liabilities and Shareholders' Equity Payables Accrued Expenses, Current Current Debt Current Portion of Capital Lease Obligation Other Current Liabilities Total Current Liabilities 3,920.00 6,004.00 6,670.00 66,928.00 64,619.00 65,253.00 LT Debt Deferred Liabilities, Non current Minority interest Other Non-Current Liabilities Total Non-Current Liabilities and MI 42,018.00 9,344.00 2.737.00 44,030.00 7,321.00 3,065.00 43,495.00 8,805.00 4,543.00 54,099.00 54,416,00 56,843.00 Total Liabilities 121,027.00 119,035.00 122,096.00 Capital Stock Retained Earnings Total Equity 305.00 77.493.00 77.798.00 317.00 80,229.00 30,546,00 323.00 81,071.00 81,394,00 Total Liabilities and Equity 198,825.00 199,581.00 203,490.00 Ordinary Shares Outstanding 3048 3162 3228


