

Answered step by step
Verified Expert Solution
Question
1 Approved Answer
work analysis & design 1. (20 pts) The following table shows signal and noise distribution parameters (in nm) for two operators. State Operator 1 Standard
work analysis & design
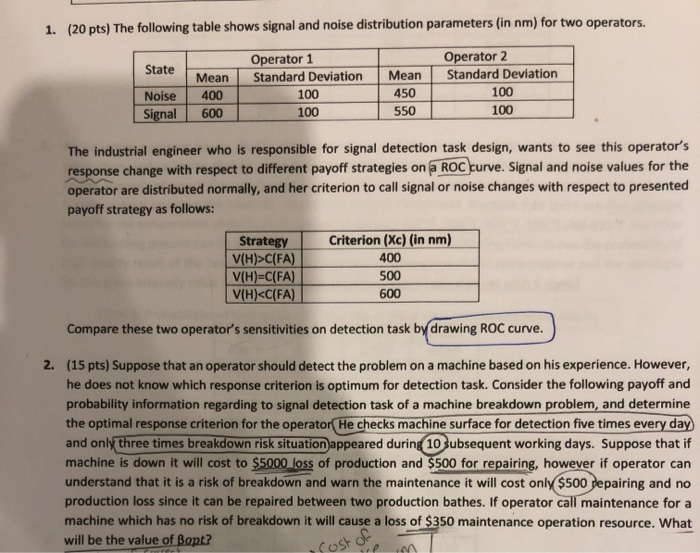
1. (20 pts) The following table shows signal and noise distribution parameters (in nm) for two operators. State Operator 1 Standard Deviation 100 100 Mean 400 600 Noise Signal Operator 2 Standard Deviation 100 100 Mean 450 550 The industrial engineer who is responsible for signal detection task design, wants to see this operator's response change with respect to different payoff strategies on a ROC curve. Signal and noise values for the operator are distributed normally, and her criterion to call signal or noise changes with respect to presented payoff strategy as follows: Strategy V(H)>C(FA) V(H)=C(FA) V(H)Step by Step Solution
There are 3 Steps involved in it
Step: 1

Get Instant Access to Expert-Tailored Solutions
See step-by-step solutions with expert insights and AI powered tools for academic success
Step: 2

Step: 3
Ace Your Homework with AI
Get the answers you need in no time with our AI-driven, step-by-step assistance
Get Started
Financial Management for Public, Health and Not-for-Profit Organizations
Authors: Steven A. Finkler, Daniel L. Smith, Thad D. Calabrese, Robert M. Purtell
5th edition
1506326846, 9781506326863, 1506326862, 978-1506326849