

Answered step by step
Verified Expert Solution
Question
1 Approved Answer
WORKFORCE COMPENSATION & TRAINING Prior-Year Compensation and Productivity Data Workforce Base Wages Compensation Incentive Pay Clotals per year) Fringe Benefits Total Regular Compensation Overtime Pay
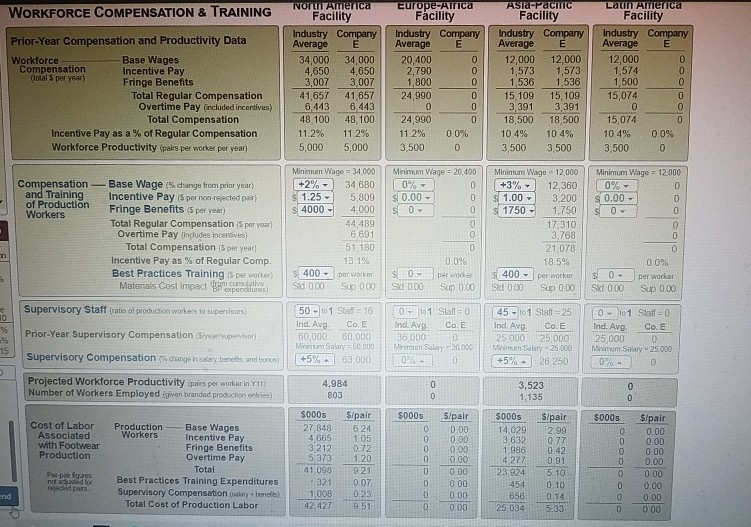
WORKFORCE COMPENSATION & TRAINING Prior-Year Compensation and Productivity Data Workforce Base Wages Compensation Incentive Pay Clotals per year) Fringe Benefits Total Regular Compensation Overtime Pay (included incentives) Total Compensation Incentive Pay as a % of Regular Compensation Workforce Productivity (pairs per worker per year) NOTITAmerica Facility Industry Company Average E 34,000 34,000 4,650 4,650 3,007 3 007 41,657 41 657 6.443 6.443 48 100 48 100 11.2% 11.2% 5,000 5,000 Europe-Alrica Facility Industry Company Average E 20,400 2,790 1,800 24,990 0 24,990 11.2% 0.0% 3,500 0 Asia-Pachi Facility Industry Company Average E 12 000 12,000 1,573 1,573 1,536 1,536 15 109 15,109 3 391 3,391 18,500 18,500 10 496 10 4% 3,500 3,500 LAUTATTETICA Facility Industry Company Average E 12,000 0 1,574 1.500 0 15,074 0 15,074 0 10.4% 0.0% 3.500 0 OOOOO Minimum Viage = 20,400 0 S 0.00 - S0 0%- Minimum Wage - 12.000 0%- $ 0.00 0 Compensation -Base Wage (% change from prior year) and Training Incentive Pay per non-rejected par of Production Fringe Benefits (5 per year) Workers Total Regular Compensation (Sper year Overtime Pay includes incentives) Total Compensation is per year Incentive Pay as % of Regular Comp Best Practices Training is per worker) Materials Cost impact email expenditures) ) Minimum Wage = 34.000 +2% - 34 680 1.25 - 5.809 4000 4,000 44.489 6691 51,180 13 19 400 per worker Sid 0.00 Sup 000 8OOOOOC Minimum Wage 12.000 +3% - 12,360 s 1.00 - 3,200 1750 1,750 17,310 3.768 21.078 18.596 $ 400- Sid 0.00 Sup 000 SIDOOOO 0 0.0% per worker 0.0% per worker Sup 000 s0 Sid 0.00 per worker S 0 - Sid 0,00 Sup 0.00 Supervisory Staff (ratio of production workers to supervisors) Prior-Year Supervisory Compensation Syed 50-101 Sa 16 Ind. Ave Co. E 60,000 60.000 Mmm Salary 60.000 +5% 63.000 0 101 Sb-0 Ind. Av Co. E 35 000 0 Wine Salary - 36.000 0 96 15 45 - 1 Slalt=25 Ind. Avg Co. E 25 000 25.000 Minimum Salary - 25000 -5% 26.250 0 - 101 Staff=0 Ind. Avg Co. E 25 000 0 Minimum Salary - 25.000 0 Supervisory Compensation change in salary benefits, and bono) 0% - Projected Workforce Productivity (pairs per worker in Y11) Number of Workers Employed given branded production) 4,984 803 OO 3,523 1.135 0 0 S/pair Slpair $000s S000s 0 0 Cost of Labor Associated with Footwear Production 0.00 0.00 Production Base Wages Workers Incentive Pay Fringe Benefits Overtime Pay Total Best Practices Training Expenditures Supervisory Compensation salary benet) Total Cost of Production Labor $000s 27 848 4,665 3212 5.373 41,098 *321 1,008 42,427 Slpair 6.24 1.05 0.72 1 20 9.21 0.07 0.23 9.51 DIDOOOOOO $000s 14,029 3.632 1980 4,277 23.924 454 0.00 0.00 0.00 000 0.00 0.00 Perpaus not so rejected pars 2.99 0.77 0.42 0.91 5.10 0.10 0 14 5.33 OOOOOOO S/pair 0.00 0.00 0.00 0.00 0 00 0.00 0.00 000 end 856 25 034 0 WORKFORCE COMPENSATION & TRAINING Prior-Year Compensation and Productivity Data Workforce Base Wages Compensation Incentive Pay Clotals per year) Fringe Benefits Total Regular Compensation Overtime Pay (included incentives) Total Compensation Incentive Pay as a % of Regular Compensation Workforce Productivity (pairs per worker per year) NOTITAmerica Facility Industry Company Average E 34,000 34,000 4,650 4,650 3,007 3 007 41,657 41 657 6.443 6.443 48 100 48 100 11.2% 11.2% 5,000 5,000 Europe-Alrica Facility Industry Company Average E 20,400 2,790 1,800 24,990 0 24,990 11.2% 0.0% 3,500 0 Asia-Pachi Facility Industry Company Average E 12 000 12,000 1,573 1,573 1,536 1,536 15 109 15,109 3 391 3,391 18,500 18,500 10 496 10 4% 3,500 3,500 LAUTATTETICA Facility Industry Company Average E 12,000 0 1,574 1.500 0 15,074 0 15,074 0 10.4% 0.0% 3.500 0 OOOOO Minimum Viage = 20,400 0 S 0.00 - S0 0%- Minimum Wage - 12.000 0%- $ 0.00 0 Compensation -Base Wage (% change from prior year) and Training Incentive Pay per non-rejected par of Production Fringe Benefits (5 per year) Workers Total Regular Compensation (Sper year Overtime Pay includes incentives) Total Compensation is per year Incentive Pay as % of Regular Comp Best Practices Training is per worker) Materials Cost impact email expenditures) ) Minimum Wage = 34.000 +2% - 34 680 1.25 - 5.809 4000 4,000 44.489 6691 51,180 13 19 400 per worker Sid 0.00 Sup 000 8OOOOOC Minimum Wage 12.000 +3% - 12,360 s 1.00 - 3,200 1750 1,750 17,310 3.768 21.078 18.596 $ 400- Sid 0.00 Sup 000 SIDOOOO 0 0.0% per worker 0.0% per worker Sup 000 s0 Sid 0.00 per worker S 0 - Sid 0,00 Sup 0.00 Supervisory Staff (ratio of production workers to supervisors) Prior-Year Supervisory Compensation Syed 50-101 Sa 16 Ind. Ave Co. E 60,000 60.000 Mmm Salary 60.000 +5% 63.000 0 101 Sb-0 Ind. Av Co. E 35 000 0 Wine Salary - 36.000 0 96 15 45 - 1 Slalt=25 Ind. Avg Co. E 25 000 25.000 Minimum Salary - 25000 -5% 26.250 0 - 101 Staff=0 Ind. Avg Co. E 25 000 0 Minimum Salary - 25.000 0 Supervisory Compensation change in salary benefits, and bono) 0% - Projected Workforce Productivity (pairs per worker in Y11) Number of Workers Employed given branded production) 4,984 803 OO 3,523 1.135 0 0 S/pair Slpair $000s S000s 0 0 Cost of Labor Associated with Footwear Production 0.00 0.00 Production Base Wages Workers Incentive Pay Fringe Benefits Overtime Pay Total Best Practices Training Expenditures Supervisory Compensation salary benet) Total Cost of Production Labor $000s 27 848 4,665 3212 5.373 41,098 *321 1,008 42,427 Slpair 6.24 1.05 0.72 1 20 9.21 0.07 0.23 9.51 DIDOOOOOO $000s 14,029 3.632 1980 4,277 23.924 454 0.00 0.00 0.00 000 0.00 0.00 Perpaus not so rejected pars 2.99 0.77 0.42 0.91 5.10 0.10 0 14 5.33 OOOOOOO S/pair 0.00 0.00 0.00 0.00 0 00 0.00 0.00 000 end 856 25 034 0
Step by Step Solution
There are 3 Steps involved in it
Step: 1

Get Instant Access to Expert-Tailored Solutions
See step-by-step solutions with expert insights and AI powered tools for academic success
Step: 2

Step: 3
Ace Your Homework with AI
Get the answers you need in no time with our AI-driven, step-by-step assistance
Get Started
An Introduction To Statistical Sampling In Auditing
Authors: Dan M. Guy
1st Edition
0471042323, 978-0471042327