Answered step by step
Verified Expert Solution
Question
1 Approved Answer
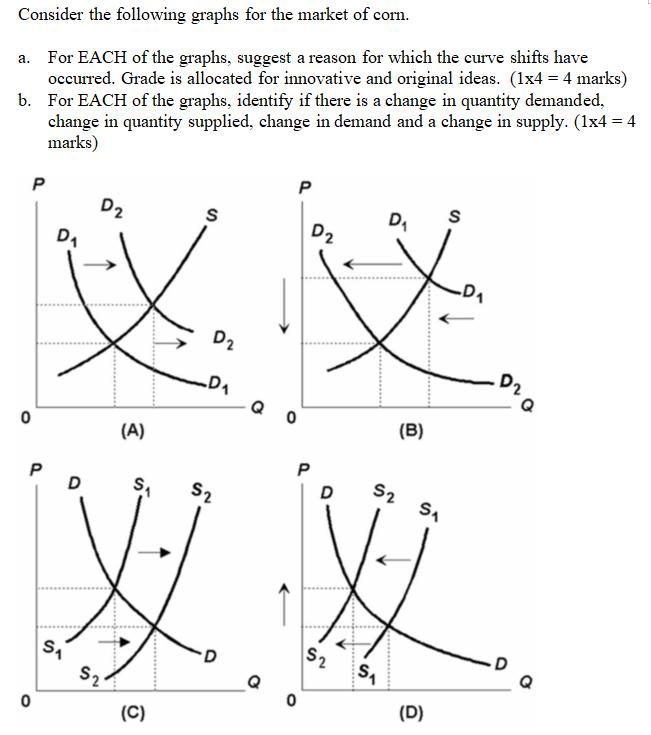
Consider the following graphs for the market of corn. a. For EACH of the graphs, suggest a reason for which the curve shifts have

Consider the following graphs for the market of corn. a. For EACH of the graphs, suggest a reason for which the curve shifts have occurred. Grade is allocated for innovative and original ideas. (1x4 = 4 marks) For EACH of the graphs, identify if there is a change in quantity demanded, change in quantity supplied, change in demand and a change in supply. (1x4 = 4 marks) b. 0 P 0 P D S D D S2 (A) S S (C) D -D P P D 52 S 52 XX S S D 0 Q0 D2 D (B) S (D) -D 010 Q
Step by Step Solution
★★★★★
3.41 Rating (164 Votes )
There are 3 Steps involved in it
Step: 1
a i The rightward shifting of demand curve might be because of increase in the ...
Get Instant Access to Expert-Tailored Solutions
See step-by-step solutions with expert insights and AI powered tools for academic success
Step: 2

Step: 3

Document Format ( 2 attachments)
635d6c6ed8eda_175471.pdf
180 KBs PDF File
635d6c6ed8eda_175471.docx
120 KBs Word File
Ace Your Homework with AI
Get the answers you need in no time with our AI-driven, step-by-step assistance
Get Started


