Answered step by step
Verified Expert Solution
Question
1 Approved Answer
Would be great if someone could do this in excel for me. 6-9. Compsys is a start-up computer company. This quarter they expect Sales of
Would be great if someone could do this in excel for me. 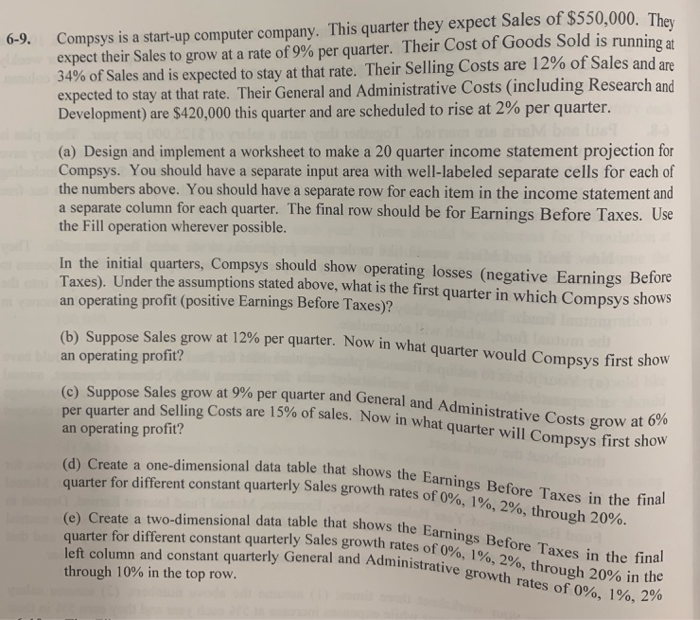
6-9. Compsys is a start-up computer company. This quarter they expect Sales of $550,000. They expect their Sales to grow at a rate of 9% per quarter. Their Cost of Goods Sold is running at 34% of Sales and is expected to stay at that rate. Their Selling Costs are 12% of Sales and are expected to stay at that rate. Their General and Administrative Costs (including Research and Development) are $420,000 this quarter and are scheduled to rise at 2% per quarter. (a) Design and implement a worksheet to make a 20 quarter income statement projection for Compsys. You should have a separate input area with well-labeled separate cells for each of the numbers above. You should have a separate row for each item in the income statement and a separate column for each quarter. The final row should be for Earnings Before Taxes. Use the Fill operation wherever possible. In the initial quarters, Compsys should show operating losses (negative Earnings Before Taxes). Under the assumptions stated above, what is the first quarter in which Compsys shows an operating profit (positive Earnings Before Taxes)? uppose Sales grow at 12% per quarter. Now in what quarter would Compsys first show an operating profit? es grow at 9% per quarter and General and Administrative Costs grow at 6% (c) Suppose Sales grow at 9% per quarter and General and A Costs are 15% of sales. Now in what quarter will Compsys first show per quarter and Selling Costs are 15% of salee an operating profit? (d) Create a one-dimensional data table that shows the Far quarter for different constant quarterly Sales growth rates of ansional data table that shows the Earnings Before Taxes in the final Sales growth rates of 0%, 1%, 2%, through 20%. (e) Create a two-dimensional data table that shows the quarter for different constant quarterly Sales growth rates of left column and constant quarterly General and Administra through 10% in the top row. ata table that shows the Earnings Before Taxes in the final Sales growth rates of 0%, 1%, 2%, through 20% in the al and Administrative growth rates of 0%, 1%,2 Step by Step Solution
There are 3 Steps involved in it
Step: 1

Get Instant Access to Expert-Tailored Solutions
See step-by-step solutions with expert insights and AI powered tools for academic success
Step: 2

Step: 3
Ace Your Homework with AI
Get the answers you need in no time with our AI-driven, step-by-step assistance
Get Started