would i be able to get some help in solving these problems
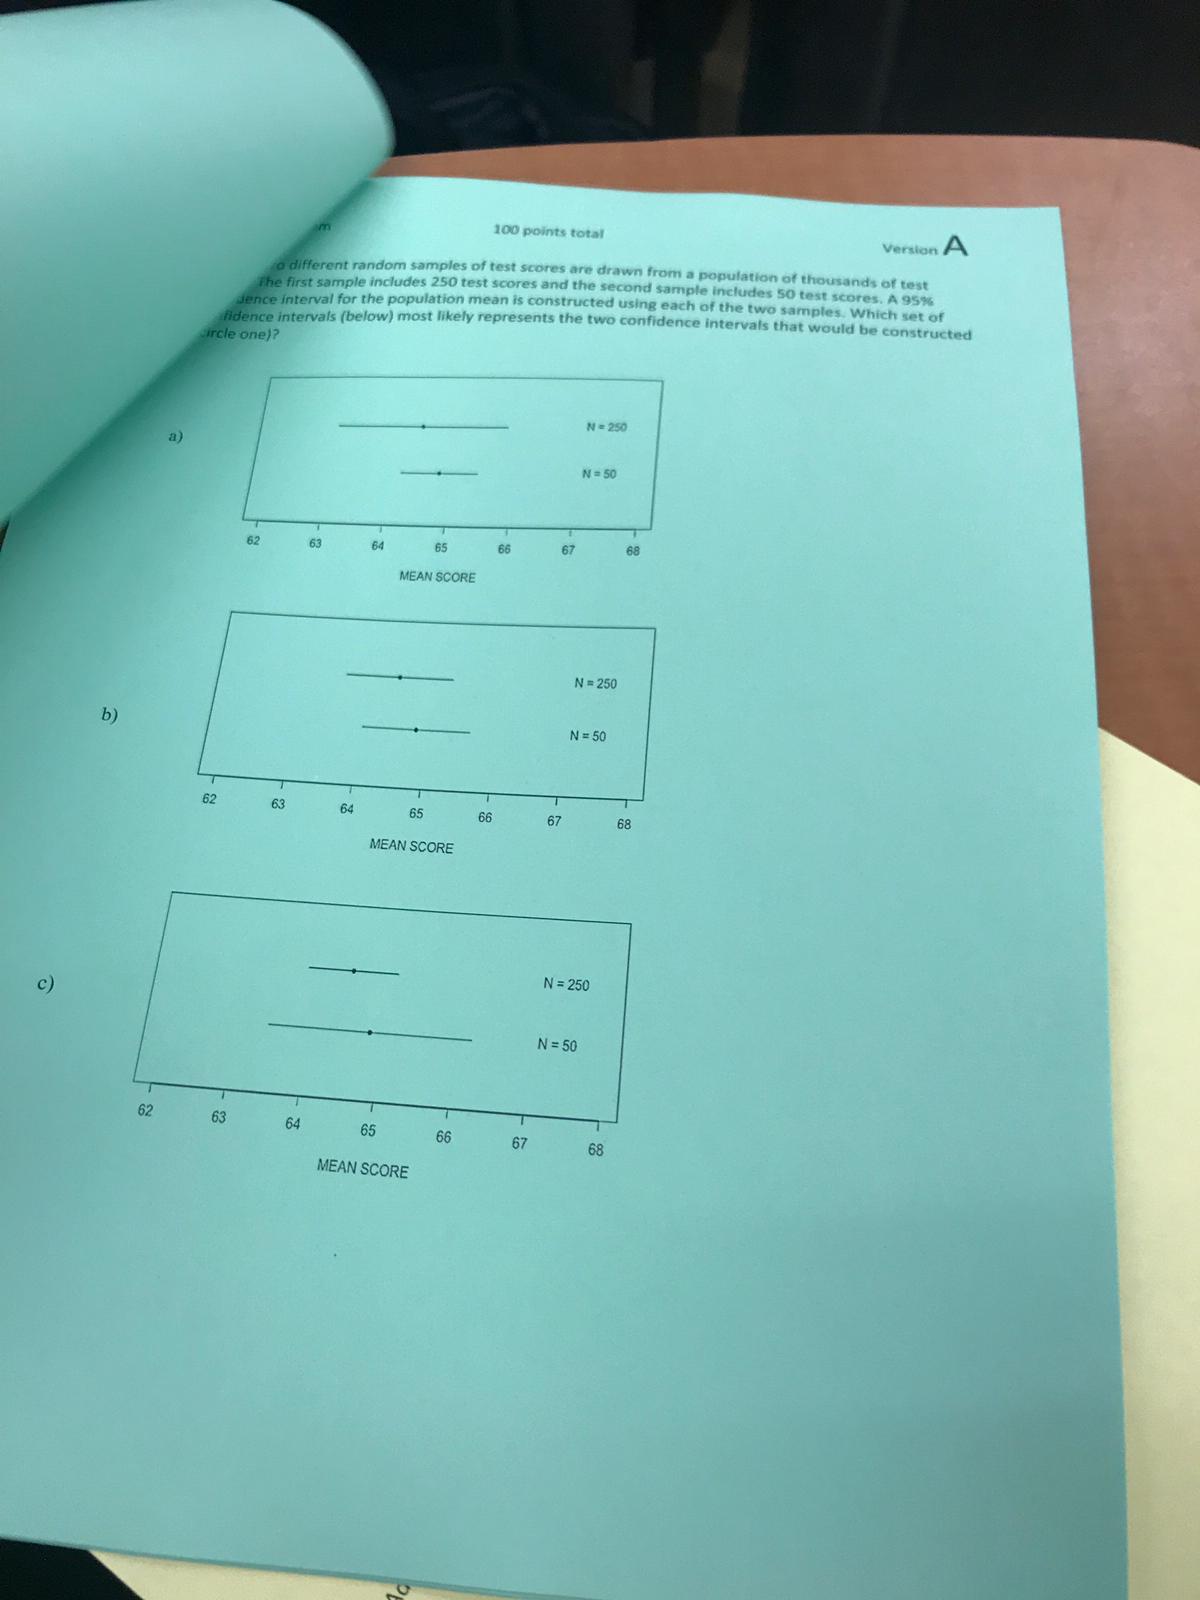
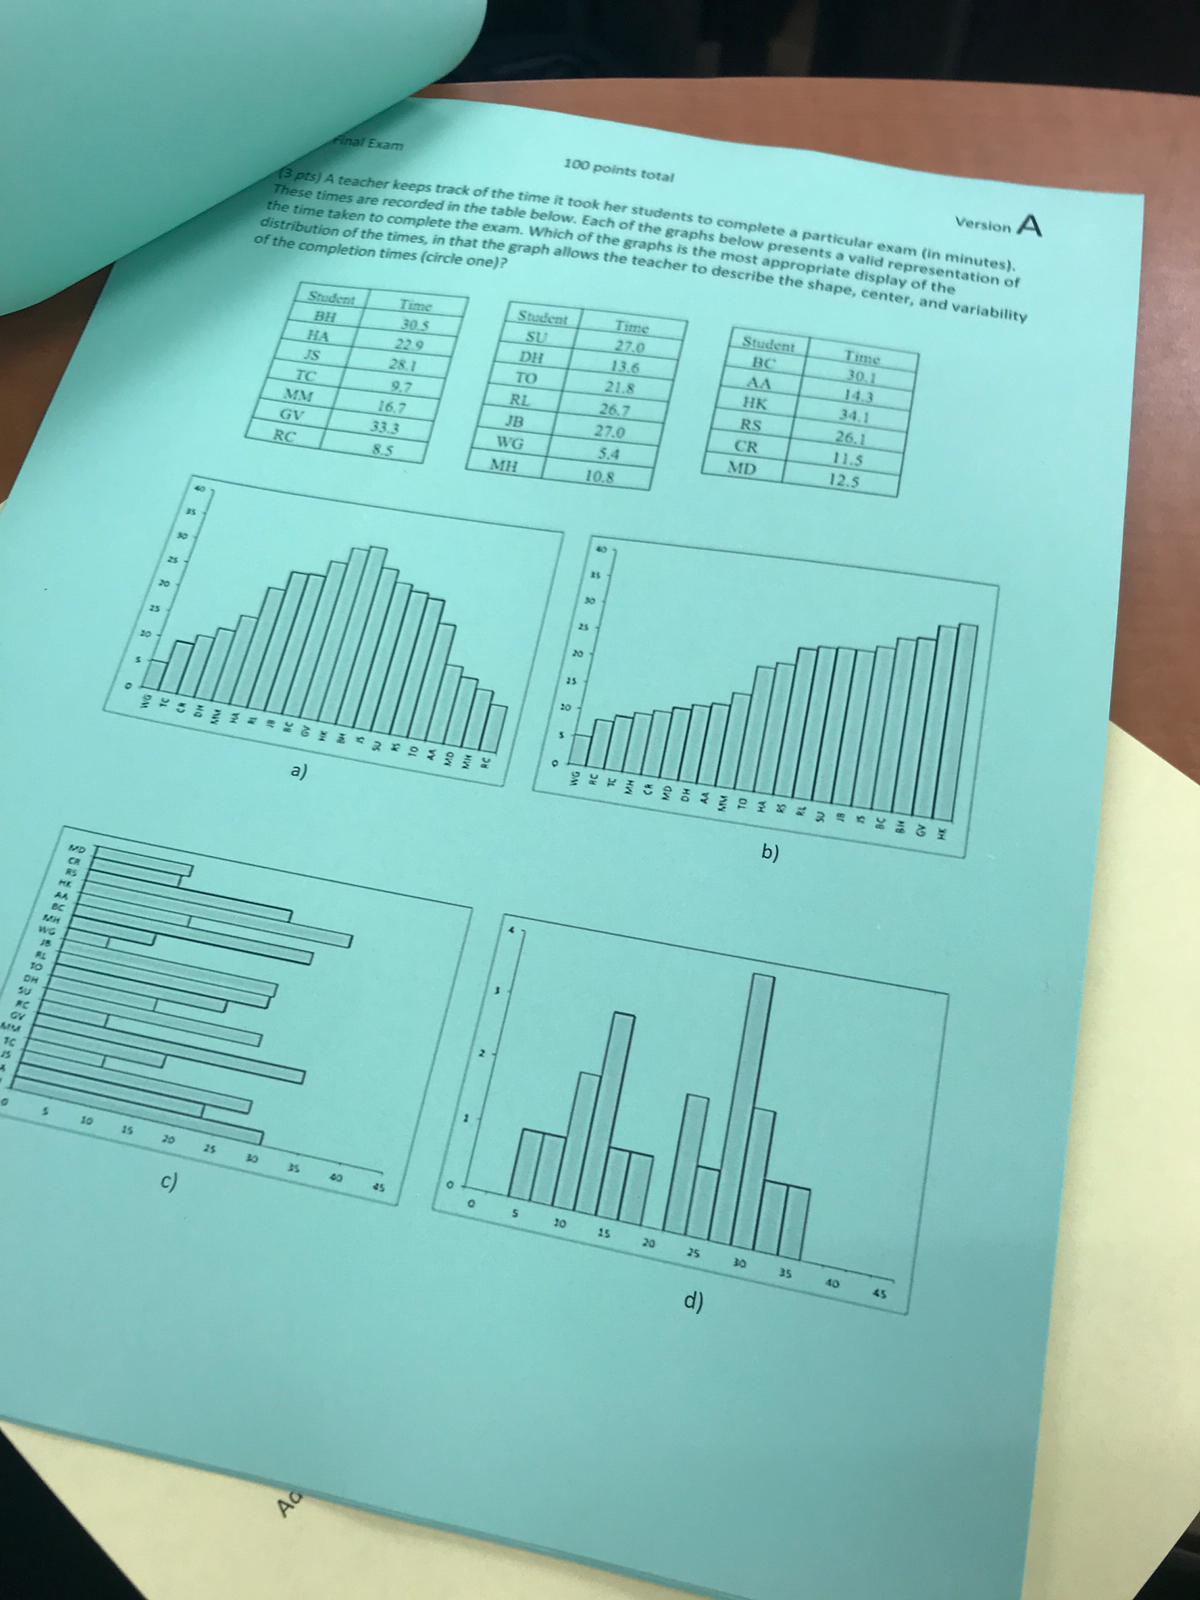
100 points total version A a different random samples of test scores are drawn from a population of thousands of test The first sample includes 250 test scores and the second sample includes 50 test scores. A 95% dence interval for the population mean is constructed using each of the two samples. Which set of idence intervals (below) most likely represents the two confidence intervals that would be constructed Circle one)? N = 250 N = 50 62 63 64 65 67 MEAN SCORE V = 250 b N = 50 62 63 64 65 66 67 68 MEAN SCORE N = 250 c) N = 50 62 63 64 65 66 67 68 MEAN SCOREfinal Exam 100 points total Version A (3 pts) A teacher keeps track of the time it took her students to complete a particular exam (in minutes). These times are recorded in the table below. Each of the graphs below presents a valid representation of the time taken to complete the exam. Which of the graphs is the most appropriate display of the distribution of the times, in that the graph allows the teacher to describe the shape, center, and variability of the completion times (circle one)? Student Time Student Time Student 27.0 Time BH SU BC 30.1 HA 22 9 DH 13.6 AA 14.3 JS 28.1 TO 21.8 HK 34.1 TC 9.7 RL 26.7 RS MM 26.1 16,7 JB 27.0 CR GV 1 1.5 33.3 RC WG 5.4 MD 12.5 85 MH 10.8 a) b) 10 15 25 20 35 o C) 5 10 25 20 25 30 35 40 d)STOR 155 Final Exam 100 points total Version A 4. (3 pts) A researcher was interested in comparing the heights of men from two different countries. Independent random samples of men from Country A and Country B were gathered. The following 95% confidence interval was obtained for wa-Ha, the difference between the mean heights of men in Country A and B: (0.17 in, 4.21 in). What does the confidence interval suggest about the population means (circle one)? a) The confidence interval does not include 0, which suggests that the two population means might be equal. There doesn't appear to be a significant difference between the men's mean heights. The confidence interval includes only positive values, which suggests that the mean height of men in Country A is greater than the mean height of men from Country B. c) The confidence interval includes only positive values, which suggests that the mean height of men in Country B is greater than the mean height of men from Country A. d) The confidence interval includes only positive values, which suggests the two population means might be equal. There doesn't appear to be a significant difference between the mean heights of the men from the two countries. 5. (3 pts) Circle the (one) interpretation of the confidence interval that correctly interprets the situation from question 4. a) 95% of all difference in heights from random samples of men from countries A and B are contained within the confidence interval b) If the process of constructing this confidence interval was repeated on many different random samples of men from countries A and B, approximately 95% of the confidence intervals would contain the mean difference in height for all men from these two countries. c) The chances that the mean difference in height for all men from these two countries falls within the confidence interval is 95%. d) There is a 95% chance that a sample of men from countries A and B will have a difference in height within the confidence interval. 6. (3 pts) It is believed that about 37% of college students binge drink (5 or more drinks for men, and 4 or more drinks for women, in two hours). Administrators at a small university of 6,000 students want to do a study to determine if the proportion of their students who binge drink differs from 37%. They select a sample of 98 students enrolled at the university to survey about their drinking behavior. When generating (circle one)? the randomization distribution for this test, how large should each individual randomization sample be a) 6,000 because that is the size of the university b) 98 because that is the size of the original sample 1,000 to get an accurate randomization distribution 2,220 because that is 37% of the students at the university