Answered step by step
Verified Expert Solution
Link Copied!

Question

1 Approved Answer

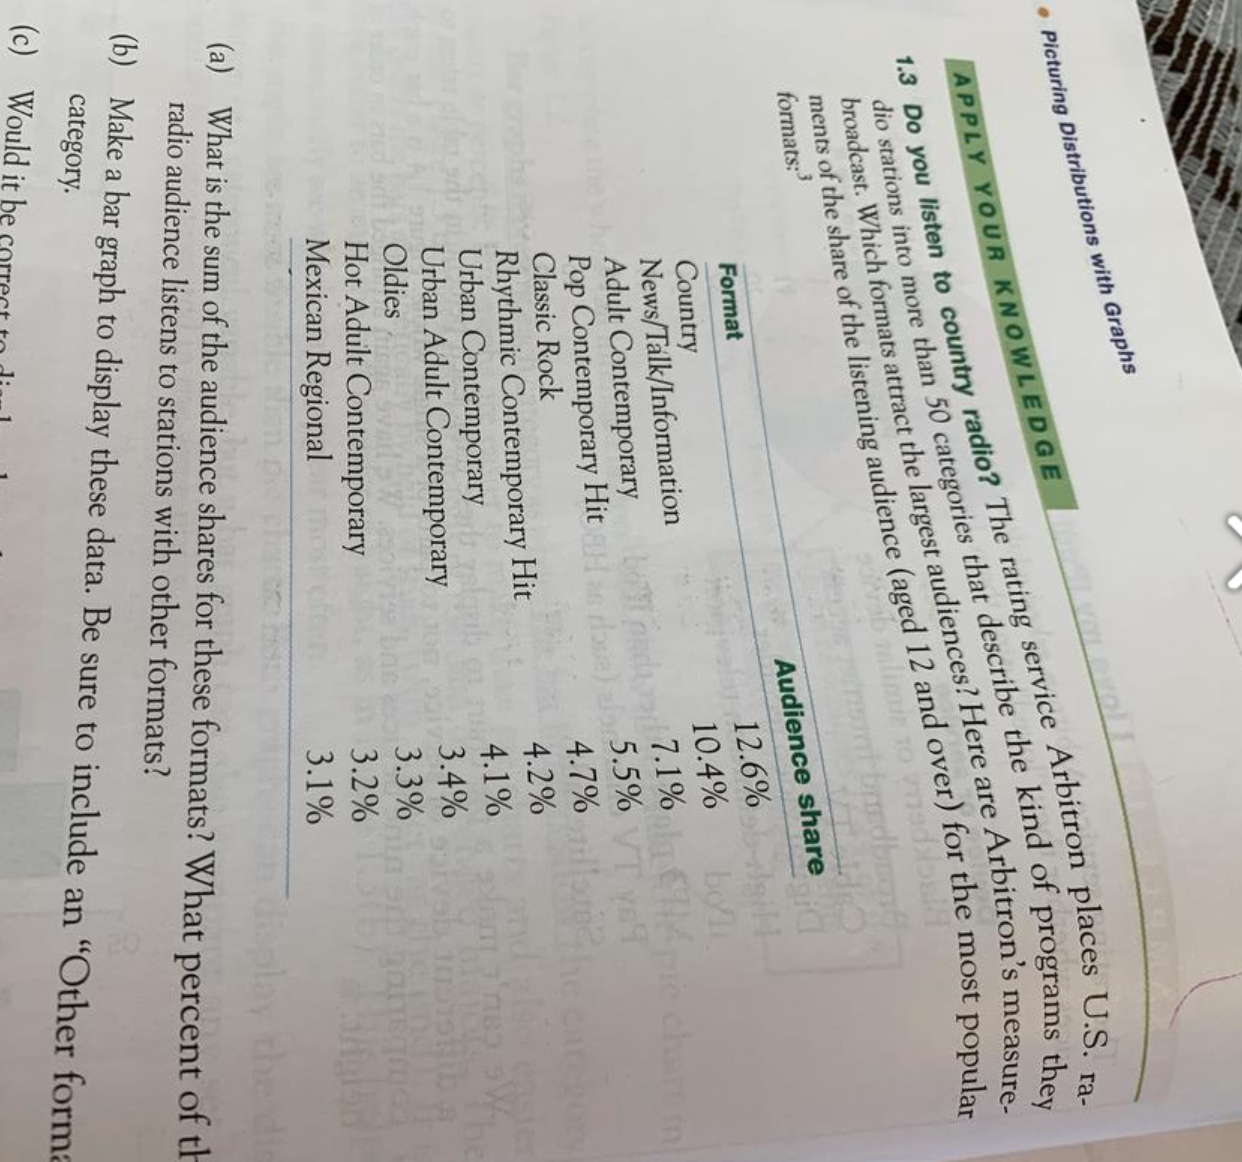
Would it be correct to display these data in a pie chart. Why? . Picturing Distributions with Graphs vice Arbitron places U.S. ra- APPLY YOUR

Would it be correct to display these data in a pie chart. Why?

image text in transcribed
. Picturing Distributions with Graphs vice Arbitron places U.S. ra- APPLY YOUR KNOWLEDGE dio stations into more than 50 categories that describe the kind of programs they broadcast. Which formats attract the largest audiences? Here are Arbitron's measure ments of the share of the listening audience (aged 12 and over) for the most popular limit To formats:3 Audience share Format 12.6% Country 10.4% boll News/Talk/Information Adult Contemporary 7.1%to chart in Pop Contemporary Hit rowe ) alar 5.5% VT YET Classic Rock 4.7% Rhythmic Contemporary Hit 4.2% Urban Contemporary 4.1% Urban Adult Contemporary 3.4% Oldies 3.3% Hot Adult Contemporary Mexican Regional 3.2% 3.1% display the die (a) What is the sum of the audience shares for these formats? What percent of th radio audience listens to stations with other formats? category. (b) Make a bar graph to display these data. Be sure to include an "Other form: Would it be co

Step by Step Solution

There are 3 Steps involved in it

Step: 1

blur-text-image

Get Instant Access to Expert-Tailored Solutions

See step-by-step solutions with expert insights and AI powered tools for academic success

Step: 2

blur-text-image

Step: 3

blur-text-image

Ace Your Homework with AI

Get the answers you need in no time with our AI-driven, step-by-step assistance

Get Started

Recommended Textbook for

Business Analytics Data Analysis and Decision Making

Authors: S. Christian Albright, Wayne L. Winston

5th edition

1133629601, 9781285965529 , 978-1133629603

More Books

Students also viewed these Mathematics questions

Question

Apply models of decision making

Answered: 1 week ago