

Answered step by step
Verified Expert Solution
Question
1 Approved Answer
Would some one in finance be able to explain the math as well as the steps needed to be able to plot this opportunity set
Would some one in finance be able to explain the math as well as the steps needed to be able to plot this opportunity set ? Thank you! 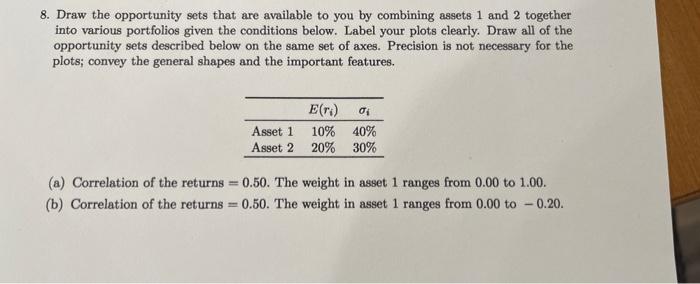
8. Draw the opportunity sets that are available to you by combining assets 1 and 2 together into various portfolios given the conditions below. Label your plots clearly. Draw all of the opportunity sets described below on the same set of axes. Precision is not necessary for the plots; convey the general shapes and the important features. E(r.) 01 Asset 1 10% 40% Asset 2 20% 30% (a) Correlation of the returns = 0.50. The weight in asset 1 ranges from 0.00 to 1.00. (b) Correlation of the returns=0.50. The weight in asset 1 ranges from 0.00 to -0.20. 8. Draw the opportunity sets that are available to you by combining assets 1 and 2 together into various portfolios given the conditions below. Label your plots clearly. Draw all of the opportunity sets described below on the same set of axes. Precision is not necessary for the plots; convey the general shapes and the important features. E(r.) 01 Asset 1 10% 40% Asset 2 20% 30% (a) Correlation of the returns = 0.50. The weight in asset 1 ranges from 0.00 to 1.00. (b) Correlation of the returns=0.50. The weight in asset 1 ranges from 0.00 to -0.20 Step by Step Solution
There are 3 Steps involved in it
Step: 1

Get Instant Access to Expert-Tailored Solutions
See step-by-step solutions with expert insights and AI powered tools for academic success
Step: 2

Step: 3
Ace Your Homework with AI
Get the answers you need in no time with our AI-driven, step-by-step assistance
Get Started
Public Finance Fundamentals
Authors: K. Moeti
3rd Edition
148512946X, 9781485129462