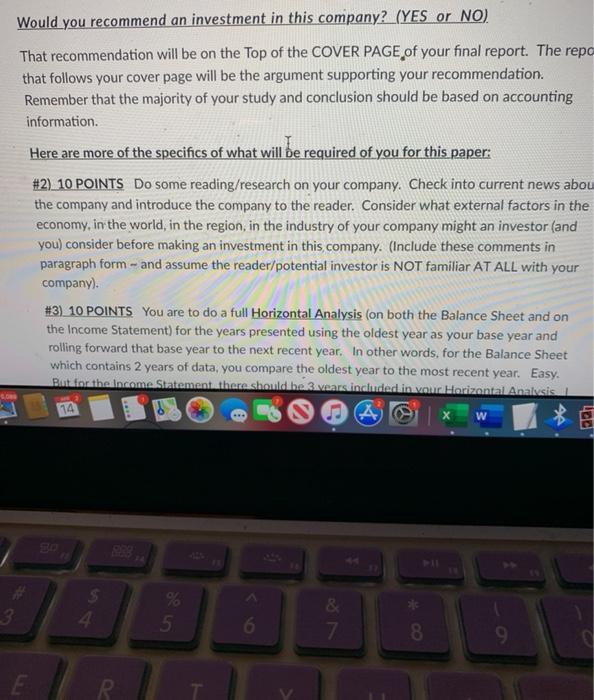
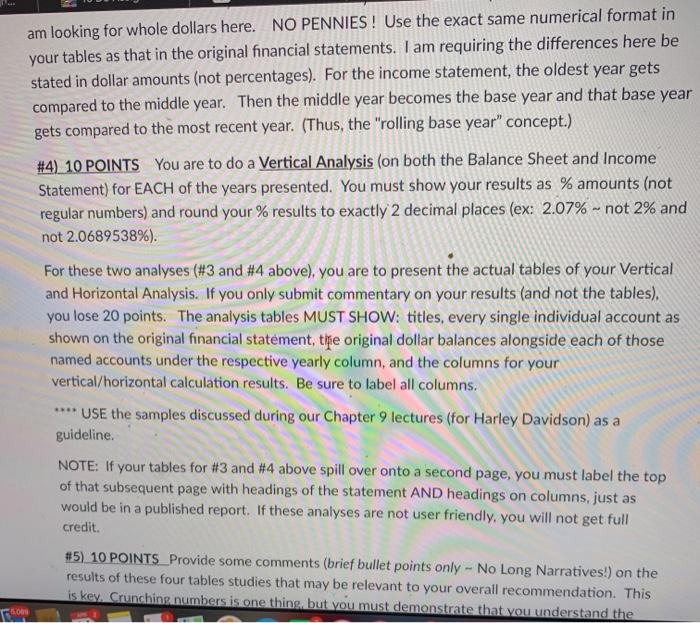
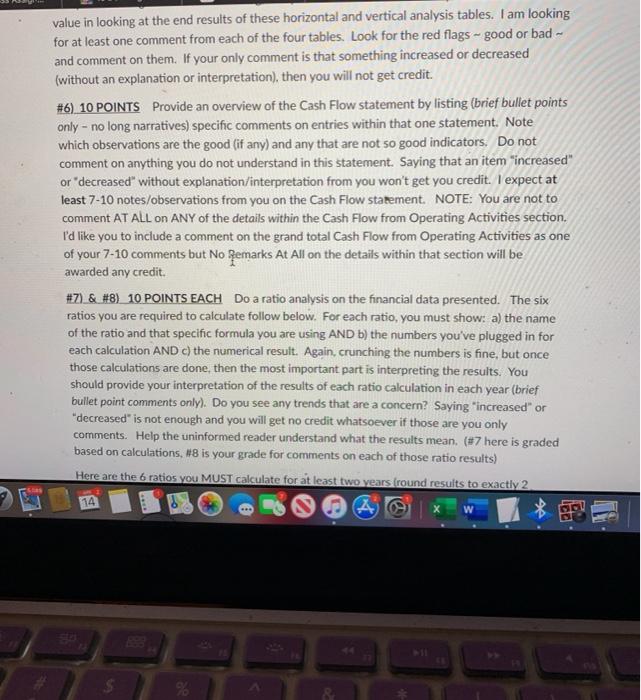
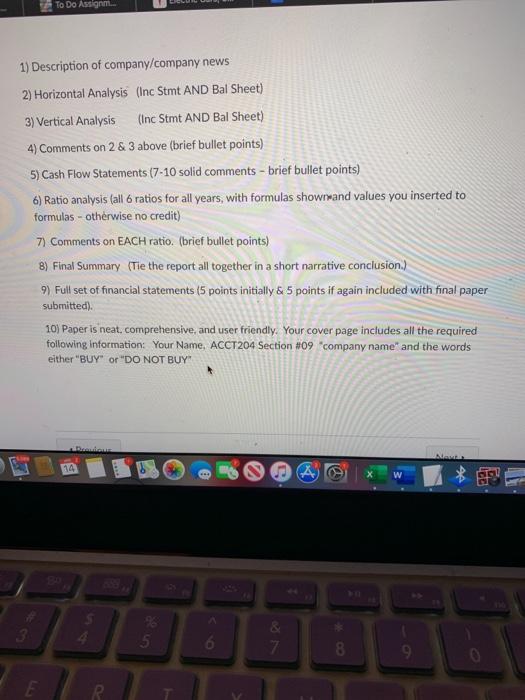
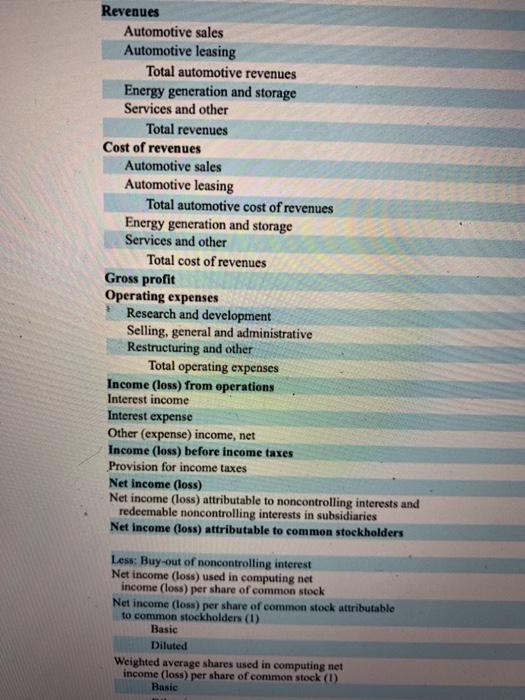
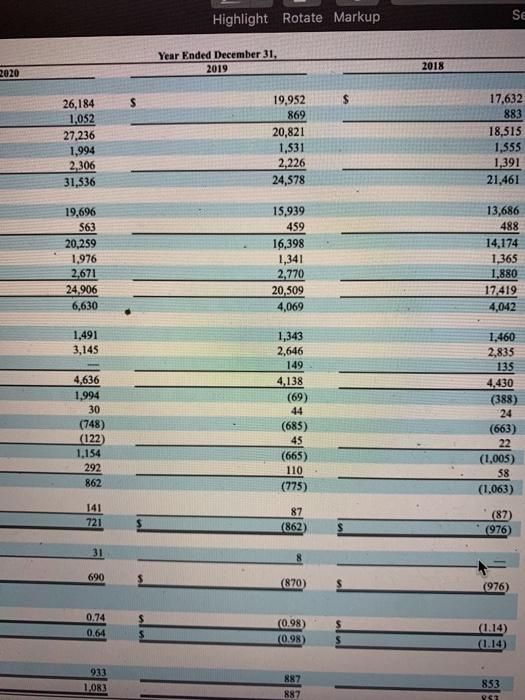
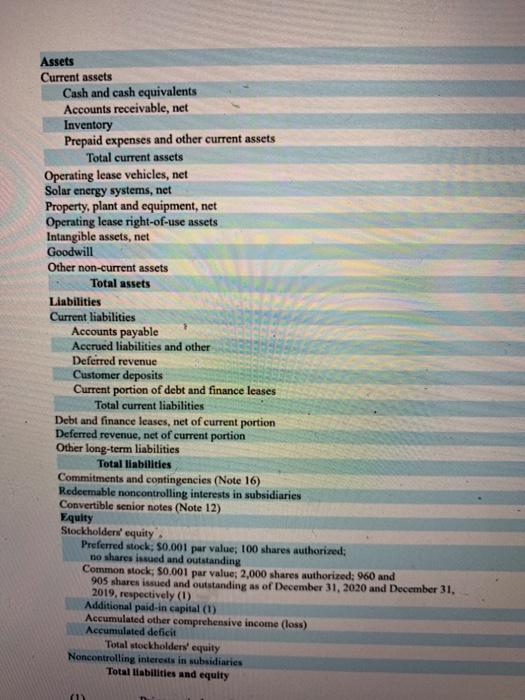
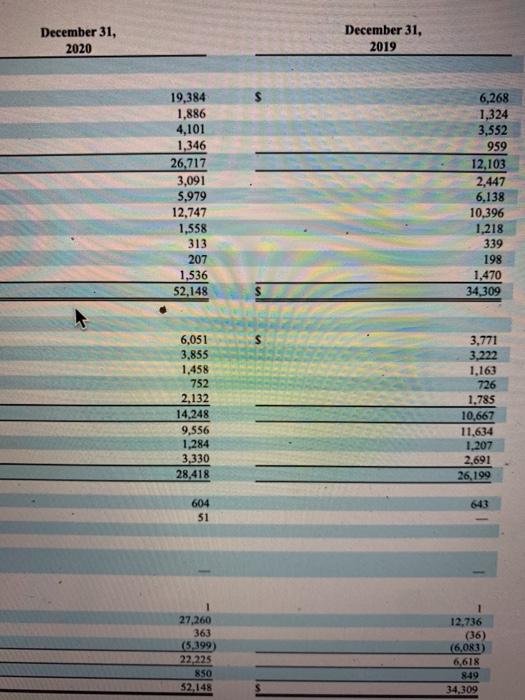
Would you recommend an investment in this company? (YES or NO) That recommendation will be on the Top of the COVER PAGE of your final report. The repo that follows your cover page will be the argument supporting your recommendation. Remember that the majority of your study and conclusion should be based on accounting information. Here are more of the specifics of what will be required of you for this paper: #2) 10 POINTS Do some reading/research on your company. Check into current news abou the company and introduce the company to the reader. Consider what external factors in the economy, in the world, in the region, in the industry of your company might an investor (and you) consider before making an investment in this company. (Include these comments in paragraph form - and assume the reader/potential investor is NOT familiar AT ALL with your company). #3) 10 POINTS You are to do a full Horizontal Analysis (on both the Balance Sheet and on the Income Statement) for the years presented using the oldest year as your base year and rolling forward that base year to the next recent year. In other words, for the Balance Sheet which contains 2 years of data, you compare the oldest year to the most recent year. Easy. Butafor the income Statement there should be vansin dindadiin oud Horizontall Analysis . 14 W 46 % 5 6 & 7. 8 9 E R. am looking for whole dollars here. NO PENNIES! Use the exact same numerical format in your tables as that in the original financial statements. I am requiring the differences here be stated in dollar amounts (not percentages). For the income statement, the oldest year gets compared to the middle year. Then the middle year becomes the base year and that base year gets compared to the most recent year. (Thus, the "rolling base year" concept.) #4) 10 POINTS You are to do a Vertical Analysis (on both the Balance Sheet and Income Statement) for EACH of the years presented. You must show your results as % amounts (not regular numbers) and round your % results to exactly 2 decimal places (ex: 2.07% - not 2% and not 2.0689538%). For these two analyses (#3 and #4 above), you are to present the actual tables of your Vertical and Horizontal Analysis. If you only submit commentary on your results (and not the tables), you lose 20 points. The analysis tables MUST SHOW: titles, every single individual account as shown on the original financial statement, te original dollar balances alongside each of those named accounts under the respective yearly column, and the columns for your vertical/horizontal calculation results. Be sure to label all columns. **** USE the samples discussed during our Chapter 9 lectures (for Harley Davidson) as a guideline NOTE: If your tables for #3 and #4 above spill over onto a second page, you must label the top of that subsequent page with headings of the statement AND headings on columns, just as would be in a published report. If these analyses are not user friendly, you will not get full credit. #5) 10 POINTS_Provide some comments (brief bullet points only - No Long Narratives!) on the results of these four tables studies that may be relevant to your overall recommendation. This is key. Crunching numbers is one thing, but you must demonstrate that you understand the 540 value in looking at the end results of these horizontal and vertical analysis tables. I am looking for at least one comment from each of the four tables. Look for the red flags - good or bad - and comment on them. If your only comment is that something increased or decreased (without an explanation or interpretation), then you will not get credit. #6) 10 POINTS Provide an overview of the Cash Flow statement by listing (brief bullet points only - no long narratives) specific comments on entries within that one statement. Note which observations are the good (if any) and any that are not so good indicators. Do not comment on anything you do not understand in this statement. Saying that an item "increased" or "decreased without explanation/interpretation from you won't get you credit. I expect at least 7-10 notes/observations from you on the Cash Flow statement. NOTE: You are not to comment AT ALL on ANY of the details within the Cash Flow from Operating Activities section. I'd like you to include a comment on the grand total Cash Flow from Operating Activities as one of your 7-10 comments but No Remarks At All on the details within that section will be awarded any credit. #7) ) 10 POINTS EACH Do a ratio analysis on the financial data presented. The six ratios you are required to calculate follow below. For each ratio, you must show: a) the name of the ratio and that specific formula you are using AND b) the numbers you've plugged in for each calculation AND C) the numerical result. Again, crunching the numbers is fine, but once those calculations are done, then the most important part is interpreting the results. You should provide your interpretation of the results of each ratio calculation in each year (brief bullet point comments only). Do you see any trends that are a concern? Saying increased" or decreased" is not enough and you will get no credit whatsoever if those are you only comments. Help the uninformed reader understand what the results mean. (#7 here is graded based on calculations, #8 is your grade for comments on each of those ratio results) Here are the 6 ratios you MUST calculate for at least two years fround results to exactly 2 14 4 % decimal places): Working Capital (in dollars - this is not a "ratio," but this calculation is study) important to your Current Ratio Debt to Assets ratio Debt to Equity ratio Return on Investment (a.k.a. Return on Assets) - IMPORTANT: here I want you to use "Total Assets" in place of Average Total Assets in the formula Net Margin Remember that these are the same 6 ratios that we reviewed (will review) during our Chapter 9 lectures in regard to the McDonald's company. #9) 10 POINTS Final Summary. (see below) #10) 10 POINTS Submission of final paper which will include all individual components. The paper is neat, user friendly, tables are all labeled on all pages, there are no typos, etc. (see below) #11) 5 POINTS The full set of financial statements is again attached to the final term paper submitted in April 2021. TOTAL = 100 Points (max of 5 points from February portion + max of 95 points here) General comments: 14 A W To Do Assignm. 1) Description of company/company news 2) Horizontal Analysis (Inc Stmt AND Bal Sheet) 3) Vertical Analysis (Inc Stmt AND Bal Sheet) 4) Comments on 2 & 3 above (brief bullet points) 5) Cash Flow Statements (7-10 solid comments - brief bullet points) 6) Ratio analysis (all 6 ratios for all years, with formulas shown and values you inserted to formulas - otherwise no credit) 7) Comments on EACH ratio. (brief bullet points) 8) Final Summary (Tie the report all together in a short narrative conclusion.) 9) Full set of financial statements (5 points initially & 5 points if again included with final paper submitted). 10) Paper is neat comprehensive, and user friendly. Your cover page includes all the required following information: Your Name, ACCT204 Section #09 company name' and the words either "BUY" or "DO NOT BUY W 5 6. 7 8. 9 0 E R. Revenues Automotive sales Automotive leasing Total automotive revenues Energy generation and storage Services and other Total revenues Cost of revenues Automotive sales Automotive leasing Total automotive cost of revenues Energy generation and storage Services and other Total cost of revenues Gross profit Operating expenses Research and development Selling, general and administrative Restructuring and other Total operating expenses Income (loss) from operations Interest income Interest expense Other (expense) income, net Income (loss) before income taxes Provision for income taxes Net income (loss) Net income (loss) attributable to noncontrolling interests and redeemable noncontrolling interests in subsidiaries Net Income (loss) attributable to common stockholders Less: Buy-out of noncontrolling interest Net income (loss) used in computing net income (loss) per share of common stock Net income (loss) per share of common stock attributable to common stockholders (1) Basic Diluted Weighted average shares used in computing net income (loss) per share of common stock (1) Basic Highlight Rotate Markup SE Year Ended December 31, 2019 2018 2020 $ 26,184 1,052 27,236 1,994 2,306 31,536 19,952 869 20,821 1.531 2,226 24,578 17.632 883 18,515 1,555 1,391 21,461 19,696 563 20,259 1.976 2.671 24,906 6,630 15,939 459 16,398 1,341 2,770 20,309 4,069 13,686 488 14.174 1,365 1.880 17.419 4,042 1,491 3,145 4,636 1,994 30 (748) (122) 1.154 292 862 1,343 2,646 149 4,138 (69) 44 (685) 45 (665) 110 (775) 1,460 2,835 135 4.430 (388) 24 (663) 22 (1.005) 58 (1.063) 141 721 87 (862 (87) (976) 31 690 (870) (976 0.74 0.64 (0.98) (0.98) (1.14) 933 1,083 887 887 853 $ Assets Current assets Cash and cash equivalents Accounts receivable, net Inventory Prepaid expenses and other current assets Total current assets Operating lease vehicles, net Solar energy systems, net Property, plant and equipment, net Operating lease right-of-use assets Intangible assets, net Goodwill Other non-current assets Total assets Liabilities Current liabilities Accounts payable Accrued liabilities and other Deferred revenue Customer deposits Current portion of debt and finance leases Total current liabilities Debt and finance leases, net of current portion Deferred revenue, net of current portion Other long-term liabilities Total liabilities Commitments and contingencies (Note 16) Redeemable noncontrolling interests in subsidiaries Convertible senior notes (Note 12) Equity Stockholders' equity Preferred stock, 50.001 par value; 100 shares authorized; no shares issued and outstanding Common stock: 50.001 par value; 2,000 shares authorized; 960 and 905 shares issued and outstanding as of December 31, 2020 and December 31, 2019, respectively (1) Additional paid-in capital (1) Accumulated other comprehensive income (loss) Accumulated deficit Total stockholders' equity Noncontrolling interests in subsidiaries Total liabilities and equity December 31, 2020 December 31, 2019 19,384 1,886 4,101 1,346 26,717 3,091 5,979 12,747 1,558 313 207 1,536 52,148 6,268 1,324 3,552 959 12,103 2,447 6,138 10,396 1,218 339 198 1,470 34309 6,051 3.855 1,458 752 2,132 14.248 9,556 1,284 3,330 28,418 3,771 3,222 1.163 726 1.785 10,667 11.634 1,207 2.691 26,199 604 51 1 27.260 363 (5,399) 22,225 850 32.148 12.736 (36) (6,083) 6,618 849 34,309 Would you recommend an investment in this company? (YES or NO) That recommendation will be on the Top of the COVER PAGE of your final report. The repo that follows your cover page will be the argument supporting your recommendation. Remember that the majority of your study and conclusion should be based on accounting information. Here are more of the specifics of what will be required of you for this paper: #2) 10 POINTS Do some reading/research on your company. Check into current news abou the company and introduce the company to the reader. Consider what external factors in the economy, in the world, in the region, in the industry of your company might an investor (and you) consider before making an investment in this company. (Include these comments in paragraph form - and assume the reader/potential investor is NOT familiar AT ALL with your company). #3) 10 POINTS You are to do a full Horizontal Analysis (on both the Balance Sheet and on the Income Statement) for the years presented using the oldest year as your base year and rolling forward that base year to the next recent year. In other words, for the Balance Sheet which contains 2 years of data, you compare the oldest year to the most recent year. Easy. Butafor the income Statement there should be vansin dindadiin oud Horizontall Analysis . 14 W 46 % 5 6 & 7. 8 9 E R. am looking for whole dollars here. NO PENNIES! Use the exact same numerical format in your tables as that in the original financial statements. I am requiring the differences here be stated in dollar amounts (not percentages). For the income statement, the oldest year gets compared to the middle year. Then the middle year becomes the base year and that base year gets compared to the most recent year. (Thus, the "rolling base year" concept.) #4) 10 POINTS You are to do a Vertical Analysis (on both the Balance Sheet and Income Statement) for EACH of the years presented. You must show your results as % amounts (not regular numbers) and round your % results to exactly 2 decimal places (ex: 2.07% - not 2% and not 2.0689538%). For these two analyses (#3 and #4 above), you are to present the actual tables of your Vertical and Horizontal Analysis. If you only submit commentary on your results (and not the tables), you lose 20 points. The analysis tables MUST SHOW: titles, every single individual account as shown on the original financial statement, te original dollar balances alongside each of those named accounts under the respective yearly column, and the columns for your vertical/horizontal calculation results. Be sure to label all columns. **** USE the samples discussed during our Chapter 9 lectures (for Harley Davidson) as a guideline NOTE: If your tables for #3 and #4 above spill over onto a second page, you must label the top of that subsequent page with headings of the statement AND headings on columns, just as would be in a published report. If these analyses are not user friendly, you will not get full credit. #5) 10 POINTS_Provide some comments (brief bullet points only - No Long Narratives!) on the results of these four tables studies that may be relevant to your overall recommendation. This is key. Crunching numbers is one thing, but you must demonstrate that you understand the 540 value in looking at the end results of these horizontal and vertical analysis tables. I am looking for at least one comment from each of the four tables. Look for the red flags - good or bad - and comment on them. If your only comment is that something increased or decreased (without an explanation or interpretation), then you will not get credit. #6) 10 POINTS Provide an overview of the Cash Flow statement by listing (brief bullet points only - no long narratives) specific comments on entries within that one statement. Note which observations are the good (if any) and any that are not so good indicators. Do not comment on anything you do not understand in this statement. Saying that an item "increased" or "decreased without explanation/interpretation from you won't get you credit. I expect at least 7-10 notes/observations from you on the Cash Flow statement. NOTE: You are not to comment AT ALL on ANY of the details within the Cash Flow from Operating Activities section. I'd like you to include a comment on the grand total Cash Flow from Operating Activities as one of your 7-10 comments but No Remarks At All on the details within that section will be awarded any credit. #7) ) 10 POINTS EACH Do a ratio analysis on the financial data presented. The six ratios you are required to calculate follow below. For each ratio, you must show: a) the name of the ratio and that specific formula you are using AND b) the numbers you've plugged in for each calculation AND C) the numerical result. Again, crunching the numbers is fine, but once those calculations are done, then the most important part is interpreting the results. You should provide your interpretation of the results of each ratio calculation in each year (brief bullet point comments only). Do you see any trends that are a concern? Saying increased" or decreased" is not enough and you will get no credit whatsoever if those are you only comments. Help the uninformed reader understand what the results mean. (#7 here is graded based on calculations, #8 is your grade for comments on each of those ratio results) Here are the 6 ratios you MUST calculate for at least two years fround results to exactly 2 14 4 % decimal places): Working Capital (in dollars - this is not a "ratio," but this calculation is study) important to your Current Ratio Debt to Assets ratio Debt to Equity ratio Return on Investment (a.k.a. Return on Assets) - IMPORTANT: here I want you to use "Total Assets" in place of Average Total Assets in the formula Net Margin Remember that these are the same 6 ratios that we reviewed (will review) during our Chapter 9 lectures in regard to the McDonald's company. #9) 10 POINTS Final Summary. (see below) #10) 10 POINTS Submission of final paper which will include all individual components. The paper is neat, user friendly, tables are all labeled on all pages, there are no typos, etc. (see below) #11) 5 POINTS The full set of financial statements is again attached to the final term paper submitted in April 2021. TOTAL = 100 Points (max of 5 points from February portion + max of 95 points here) General comments: 14 A W To Do Assignm. 1) Description of company/company news 2) Horizontal Analysis (Inc Stmt AND Bal Sheet) 3) Vertical Analysis (Inc Stmt AND Bal Sheet) 4) Comments on 2 & 3 above (brief bullet points) 5) Cash Flow Statements (7-10 solid comments - brief bullet points) 6) Ratio analysis (all 6 ratios for all years, with formulas shown and values you inserted to formulas - otherwise no credit) 7) Comments on EACH ratio. (brief bullet points) 8) Final Summary (Tie the report all together in a short narrative conclusion.) 9) Full set of financial statements (5 points initially & 5 points if again included with final paper submitted). 10) Paper is neat comprehensive, and user friendly. Your cover page includes all the required following information: Your Name, ACCT204 Section #09 company name' and the words either "BUY" or "DO NOT BUY W 5 6. 7 8. 9 0 E R. Revenues Automotive sales Automotive leasing Total automotive revenues Energy generation and storage Services and other Total revenues Cost of revenues Automotive sales Automotive leasing Total automotive cost of revenues Energy generation and storage Services and other Total cost of revenues Gross profit Operating expenses Research and development Selling, general and administrative Restructuring and other Total operating expenses Income (loss) from operations Interest income Interest expense Other (expense) income, net Income (loss) before income taxes Provision for income taxes Net income (loss) Net income (loss) attributable to noncontrolling interests and redeemable noncontrolling interests in subsidiaries Net Income (loss) attributable to common stockholders Less: Buy-out of noncontrolling interest Net income (loss) used in computing net income (loss) per share of common stock Net income (loss) per share of common stock attributable to common stockholders (1) Basic Diluted Weighted average shares used in computing net income (loss) per share of common stock (1) Basic Highlight Rotate Markup SE Year Ended December 31, 2019 2018 2020 $ 26,184 1,052 27,236 1,994 2,306 31,536 19,952 869 20,821 1.531 2,226 24,578 17.632 883 18,515 1,555 1,391 21,461 19,696 563 20,259 1.976 2.671 24,906 6,630 15,939 459 16,398 1,341 2,770 20,309 4,069 13,686 488 14.174 1,365 1.880 17.419 4,042 1,491 3,145 4,636 1,994 30 (748) (122) 1.154 292 862 1,343 2,646 149 4,138 (69) 44 (685) 45 (665) 110 (775) 1,460 2,835 135 4.430 (388) 24 (663) 22 (1.005) 58 (1.063) 141 721 87 (862 (87) (976) 31 690 (870) (976 0.74 0.64 (0.98) (0.98) (1.14) 933 1,083 887 887 853 $ Assets Current assets Cash and cash equivalents Accounts receivable, net Inventory Prepaid expenses and other current assets Total current assets Operating lease vehicles, net Solar energy systems, net Property, plant and equipment, net Operating lease right-of-use assets Intangible assets, net Goodwill Other non-current assets Total assets Liabilities Current liabilities Accounts payable Accrued liabilities and other Deferred revenue Customer deposits Current portion of debt and finance leases Total current liabilities Debt and finance leases, net of current portion Deferred revenue, net of current portion Other long-term liabilities Total liabilities Commitments and contingencies (Note 16) Redeemable noncontrolling interests in subsidiaries Convertible senior notes (Note 12) Equity Stockholders' equity Preferred stock, 50.001 par value; 100 shares authorized; no shares issued and outstanding Common stock: 50.001 par value; 2,000 shares authorized; 960 and 905 shares issued and outstanding as of December 31, 2020 and December 31, 2019, respectively (1) Additional paid-in capital (1) Accumulated other comprehensive income (loss) Accumulated deficit Total stockholders' equity Noncontrolling interests in subsidiaries Total liabilities and equity December 31, 2020 December 31, 2019 19,384 1,886 4,101 1,346 26,717 3,091 5,979 12,747 1,558 313 207 1,536 52,148 6,268 1,324 3,552 959 12,103 2,447 6,138 10,396 1,218 339 198 1,470 34309 6,051 3.855 1,458 752 2,132 14.248 9,556 1,284 3,330 28,418 3,771 3,222 1.163 726 1.785 10,667 11.634 1,207 2.691 26,199 604 51 1 27.260 363 (5,399) 22,225 850 32.148 12.736 (36) (6,083) 6,618 849 34,309