Answered step by step
Verified Expert Solution
Question
1 Approved Answer
Build a stagger plot (3 individual points, do not connect them) using the midpoint of the standards (benzophenone, vanillin and benzoic acid) melting point


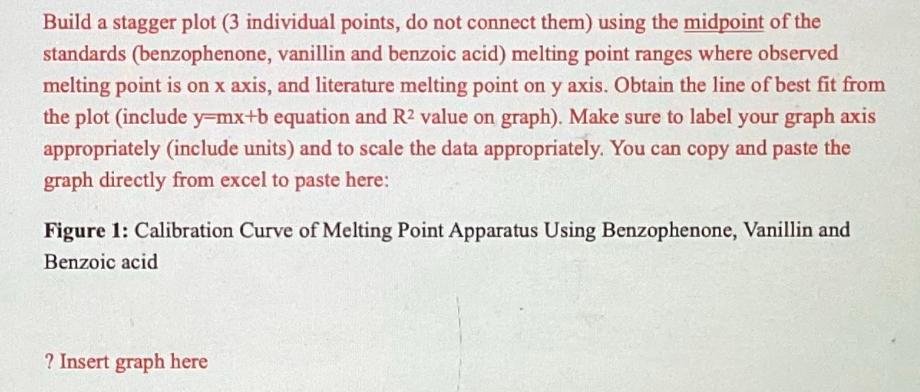
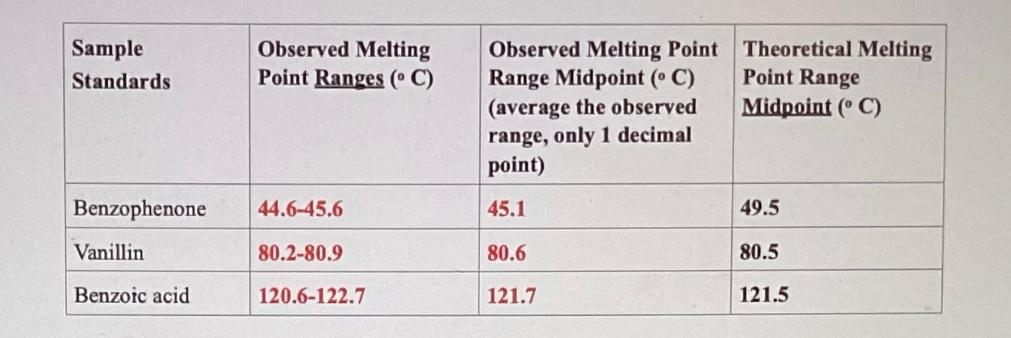
Build a stagger plot (3 individual points, do not connect them) using the midpoint of the standards (benzophenone, vanillin and benzoic acid) melting point ranges where observed melting point is on x axis, and literature melting point on y axis. Obtain the line of best fit from the plot (include y=mx+b equation and R2 value on graph). Make sure to label your graph axis appropriately (include units) and to scale the data appropriately. You can copy and paste the graph directly from excel to paste here: Figure 1: Calibration Curve of Melting Point Apparatus Using Benzophenone, Vanillin and Benzoic acid ? Insert graph here Sample Standards Observed Melting Point Ranges ( C) (average the observed Observed Melting Point Range Midpoint ( C) Theoretical Melting Point Range Midpoint ( C) range, only 1 decimal point) Benzophenone 44.6-45.6 45.1 49.5 Vanillin 80.2-80.9 80.6 80.5 Benzoic acid 120.6-122.7 121.7 121.5
Step by Step Solution
★★★★★
3.38 Rating (151 Votes )
There are 3 Steps involved in it
Step: 1

Get Instant Access to Expert-Tailored Solutions
See step-by-step solutions with expert insights and AI powered tools for academic success
Step: 2

Step: 3

Ace Your Homework with AI
Get the answers you need in no time with our AI-driven, step-by-step assistance
Get Started


