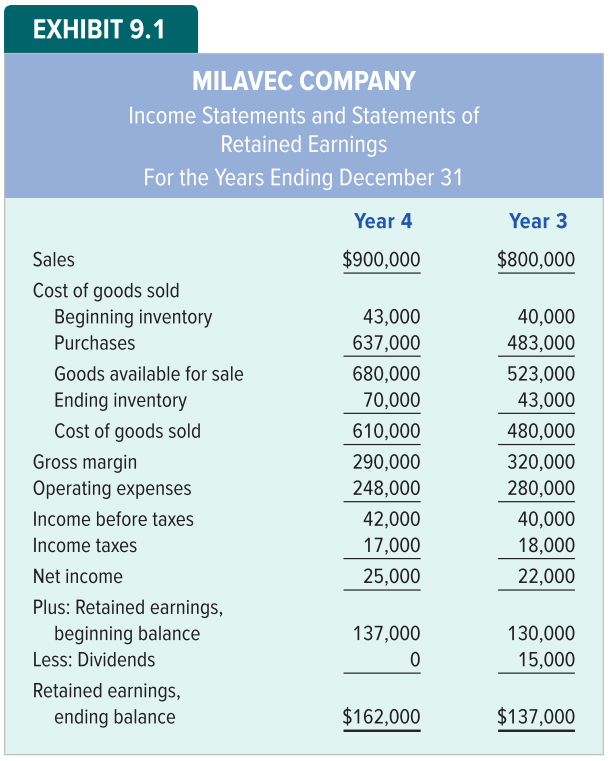
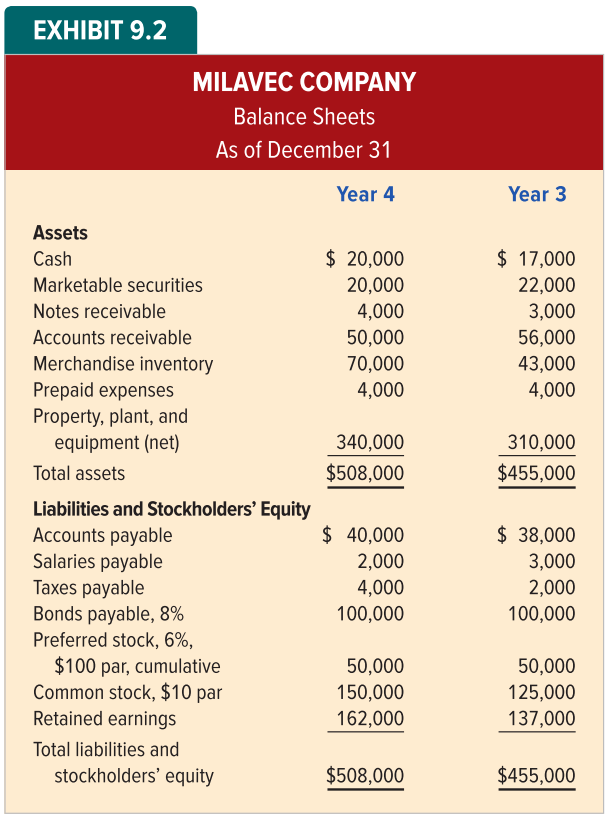
Question
write a recommendation / summary of milavec financial reports using the following formula sheet Liquidity Ratios Working Capital = Current assets Current liabilities Current Ratio
write a recommendation / summary of milavec financial reports using the following formula sheet
Liquidity Ratios
Working Capital = Current assets Current liabilities
Current Ratio = Current assets/Current liabilities
Quick Ratio (acid-test) = Quick assets/Current liabilities
Accounts Receivable Turnover = Net credit sales/Average accounts receivable
Average Days to Collect Receivables = 365/Accounts receivable turnover
Inventory Turnover = COGS/Average ending inventory
Average Days to Sell Inventory = 365/Inventory turnover
Solvency Ratios
Debt to Assets = Total liabilities/Total assets
Debt to Equity = Total liabilities/Total stockholders equity
Number of Times Interest is Earned = Earnings before interest & tax exp/Interest exp
Plant Assets to Long-Term Liabilities = Net plant assets/Long-term liabilities
Management Effectiveness Ratios
Net Margin (return on sales) = Net income/Net sales
Asset Turnover = Net sales/Average total assets
Return on Investment (ROI) = Net income/Average total assets
Return on Equity (ROE) = Net income/Avg total stockholders equity
Stock Market Ratios
Earnings per Share = Net earnings avail for CS/Avg number CS shares outstanding
Book Value per Share = Stockholders equity Preferred stock/Outstanding CS shares
Price-Earnings Ratio = Market price per share/Earnings per share
Dividend Yield = Dividends per share/Market price per share


Step by Step Solution
There are 3 Steps involved in it
Step: 1

Get Instant Access to Expert-Tailored Solutions
See step-by-step solutions with expert insights and AI powered tools for academic success
Step: 2

Step: 3

Ace Your Homework with AI
Get the answers you need in no time with our AI-driven, step-by-step assistance
Get Started


