

Question
Write an interpretation for Assets turnover, Profit margin, Market Value Added, Market to Book Ratio, Operating Cash-Flow Ratio, Cash-Flow Coverage Ratio Write an interpretation for
Write an interpretation for Assets turnover, Profit margin, Market Value Added, Market to Book Ratio, Operating Cash-Flow Ratio, Cash-Flow Coverage Ratio
Write an interpretation for Assets turnover, Profit margin, Market Value Added, Market to Book Ratio, Operating Cash-Flow Ratio, Cash-Flow Coverage Ratio
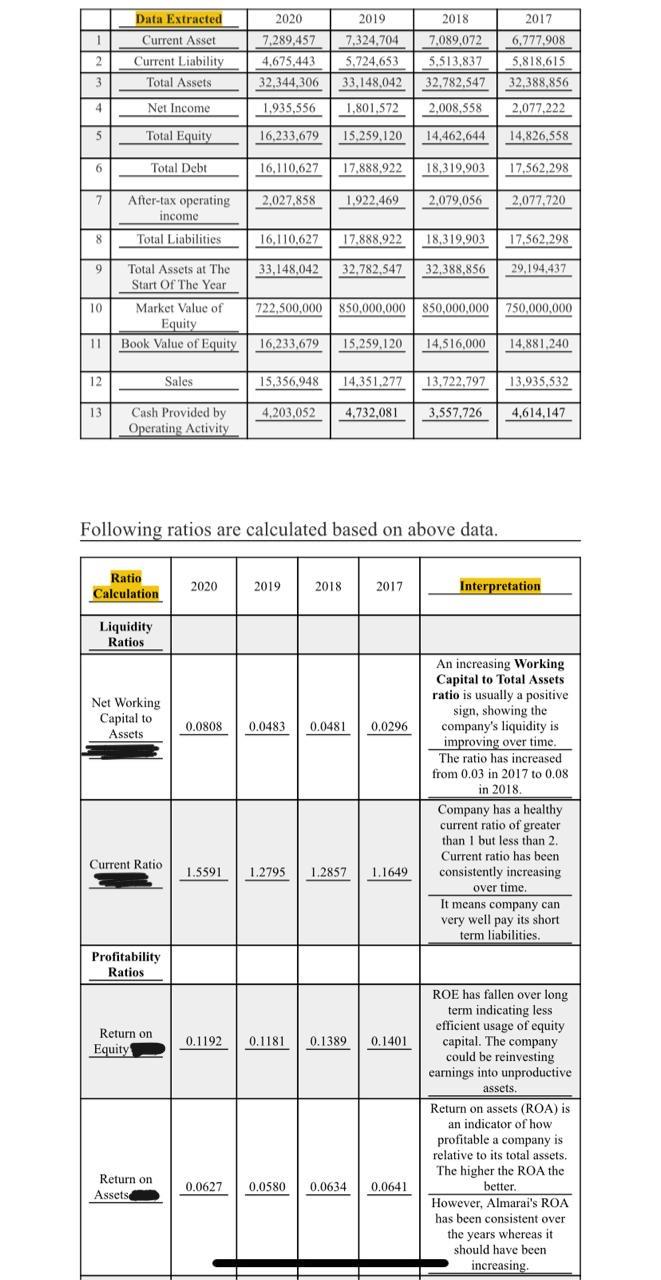
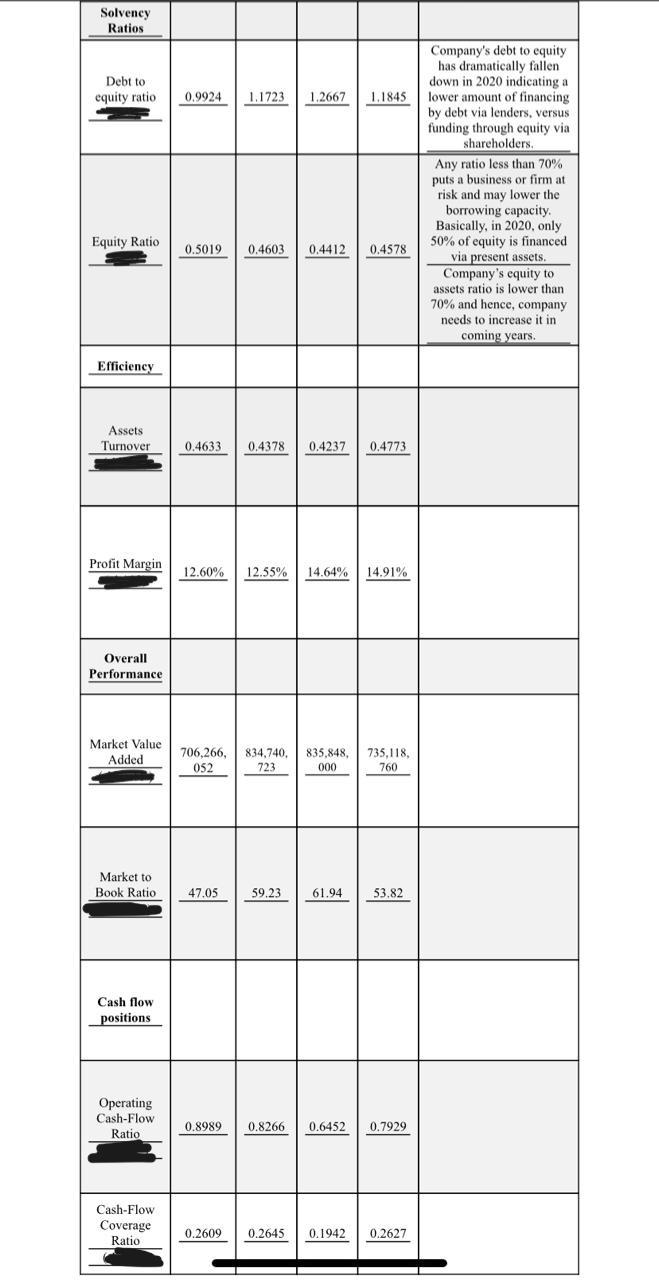
2020 2018 2017 6,777,908 1 Data Extracted Current Asset Current Liability Total Assets 7,289,457 4,675,443 2019 7,324,704 5.724,653 33,148,042 2 7,089,072 5.513,837 32.782,547 5,818,615 32,388,856 3 32,344,306 4 Net Income 1.935,556 1,801,572 2.008,558 2,077.222 5 Total Equity 16.233.679 15.259,120 14.462,644 14,826,558 6 Total Debt 16,110,627 17.888.922 18,319.903 17.562.298 7 2,027.858 1.922.469 After-tax operating income 2,079,056 2,077.720 8 Total Liabilities 16,110,627 17.888.922 18,319.903 17.562,298 9 33,148,042 Total Assets at The Start Of The Year 32,782,547 32,388,856 29,194,437 10 Market Value of 722,500,000 850,000,000 850,000,000 750,000,000 Equity 11 Book Value of Equity 16,233,679 15.259,120 14,516,000 14,881.240 12 Sales 15,356,948 14.351.277 13,722,797 13,935,532 13 4,203,052 4.732,081 3,557,726 4,614,147 Cash Provided by Operating Activity Following ratios are calculated based on above data. Ratio Calculation 2020 2019 2018 2017 Interpretation Liquidity Ratios Net Working Capital to Assets 0.0808 0.0483 0.0481 0.0296 An increasing Working Capital to Total Assets ratio is usually a positive sign, showing the company's liquidity is improving over time. The ratio has increased from 0,03 in 2017 to 0.08 in 2018 Company has a healthy current ratio of greater than I but less than 2. Current ratio has been consistently increasing over time. It means company can very well pay its short term liabilities. Current Ratio 1.5591 1.2795 1.2857 1.1649 Profitability Ratios Return on Equity 0.1192 0.1181 0.1389 0.1389 0.1401 ROE has fallen over long term indicating less efficient usage of equity capital. The company could be reinvesting earnings into unproductive assets. Return on Assets 0.0627 0.0580 0.0634 0.0641 Return on assets (ROA) is an indicator of how profitable a company is relative to its total assets. The higher the ROA the better. However, Almarai's ROA has been consistent over the years whereas it should have been increasing. Solvency Ratios Debt to equity ratio 0.9924 1.1723 12667 1.2667 1.1845 Company's debt to equity has dramatically fallen down in 2020 indicating a lower amount of financing by debt via lenders, versus funding through equity via shareholders. Any ratio less than 70% puts a business or firm at risk and may lower the borrowing capacity. Basically, in 2020, only 50% of fequity is financed via present assets. Company's equity to assets ratio is lower than 70% and hence, company needs to increase it in coming years. Equity Ratio 0.5019 0.4603 0.4412 0,4578 Efficiency Assets Turnover 0.4633 0,4378 0.4237 0.4773 Profit Margin 12.60% 12.55% 14.6% 4,91 % 14.64% 14.91% Overall Performance Market Value Added 706,266,834,740, 052 723 835,848, 000 735,118, 760 Market to Book Ratio 47.05 47,05 59.23 61.94 53.82 61.94 53.82 Cash flow positions Operating Cash-Flow Ratio 0.8989 0,8266 0.8266 0.6452 0.7929 Cash-Flow Coverage Ratio 0.2609 0.2645 0.1942 0.2627Step by Step Solution
There are 3 Steps involved in it
Step: 1

Get Instant Access to Expert-Tailored Solutions
See step-by-step solutions with expert insights and AI powered tools for academic success
Step: 2

Step: 3
Ace Your Homework with AI
Get the answers you need in no time with our AI-driven, step-by-step assistance
Get Started
Growth Linked Securities
Authors: John Williamson
1st Edition
3319683322,3319683330