

Answered step by step
Verified Expert Solution
Question
1 Approved Answer
write codes to generate this table by using python 3.1 How the Data is Collected and Analyzed Before we describe the methods that we use
write codes to generate this table by using python
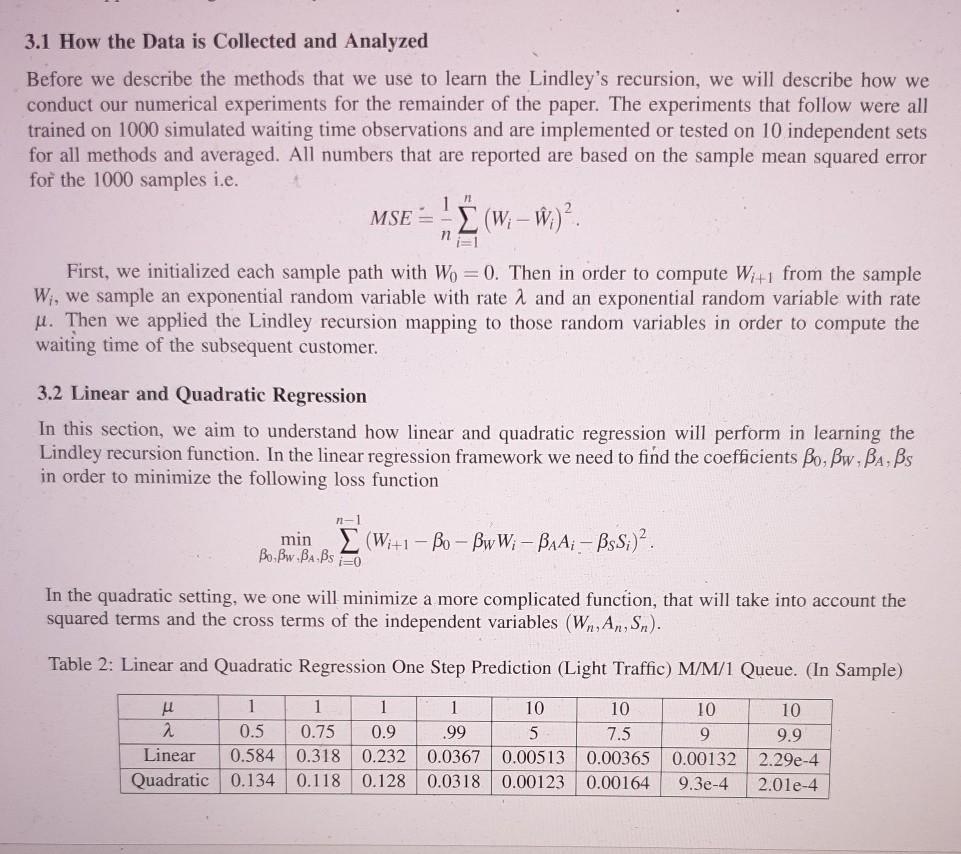
3.1 How the Data is Collected and Analyzed Before we describe the methods that we use to learn the Lindley's recursion, we will describe how we conduct our numerical experiments for the remainder of the paper. The experiments that follow were all trained on 1000 simulated waiting time observations and are implemented or tested on 10 independent sets for all methods and averaged. All numbers that are reported are based on the sample mean squared error for the 1000 samples i.e. 1 MSE = {(W; W)? n1 First, we initialized each sample path with Wo = 0. Then in order to compute W141 from the sample W;, we sample an exponential random variable with rate 2 and an exponential random variable with rate u. Then we applied the Lindley recursion mapping to those random variables in order to compute the waiting time of the subsequent customer. 3.2 Linear and Quadratic Regression In this section, we aim to understand how linear and quadratic regression will perform in learning the Lindley recursion function. In the linear regression framework we need to find the coefficients Bo, Bw.BA, Bs in order to minimize the following loss function n-1 min E (Wi+1 - Bo Bw W; - BAAi BsS;)2. Bo Bw.BA B = 0 In the quadratic setting, we one will minimize a more complicated function, that will take into account the squared terms and the cross terms of the independent variables (Wn, An, Sn). Table 2: Linear and Quadratic Regression One Step Prediction (Light Traffic) M/M/1 Queue. (In Sample) 1 1 2 0.5 0.75 Linear 0.584 0.318 Quadratic 0.134 0.118 1 0.9 0.232 0.128 1 .99 0.0367 0.0318 10 10 5 7.5 0.00513 0.00365 0.00123 0.00164 10 9 0.00132 9.3e-4 10 9.9 2.29e-4 2.01e-4 3.1 How the Data is Collected and Analyzed Before we describe the methods that we use to learn the Lindley's recursion, we will describe how we conduct our numerical experiments for the remainder of the paper. The experiments that follow were all trained on 1000 simulated waiting time observations and are implemented or tested on 10 independent sets for all methods and averaged. All numbers that are reported are based on the sample mean squared error for the 1000 samples i.e. 1 MSE = {(W; W)? n1 First, we initialized each sample path with Wo = 0. Then in order to compute W141 from the sample W;, we sample an exponential random variable with rate 2 and an exponential random variable with rate u. Then we applied the Lindley recursion mapping to those random variables in order to compute the waiting time of the subsequent customer. 3.2 Linear and Quadratic Regression In this section, we aim to understand how linear and quadratic regression will perform in learning the Lindley recursion function. In the linear regression framework we need to find the coefficients Bo, Bw.BA, Bs in order to minimize the following loss function n-1 min E (Wi+1 - Bo Bw W; - BAAi BsS;)2. Bo Bw.BA B = 0 In the quadratic setting, we one will minimize a more complicated function, that will take into account the squared terms and the cross terms of the independent variables (Wn, An, Sn). Table 2: Linear and Quadratic Regression One Step Prediction (Light Traffic) M/M/1 Queue. (In Sample) 1 1 2 0.5 0.75 Linear 0.584 0.318 Quadratic 0.134 0.118 1 0.9 0.232 0.128 1 .99 0.0367 0.0318 10 10 5 7.5 0.00513 0.00365 0.00123 0.00164 10 9 0.00132 9.3e-4 10 9.9 2.29e-4 2.01e-4
Step by Step Solution
There are 3 Steps involved in it
Step: 1

Get Instant Access to Expert-Tailored Solutions
See step-by-step solutions with expert insights and AI powered tools for academic success
Step: 2

Step: 3
Ace Your Homework with AI
Get the answers you need in no time with our AI-driven, step-by-step assistance
Get Started
Professional Microsoft SQL Server 2014 Administration
Authors: Adam Jorgensen, Bradley Ball
1st Edition
111885926X, 9781118859261