

Answered step by step
Verified Expert Solution
Question
1 Approved Answer
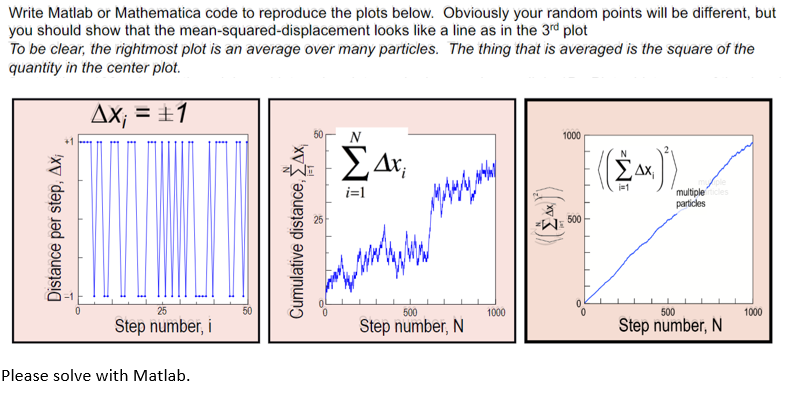
Write Matlab or Mathematica code to reproduce the plots below. Obviously your random points will be different, but you should show that the mean-squared-displacement looks
Step by Step Solution
There are 3 Steps involved in it
Step: 1

Get Instant Access to Expert-Tailored Solutions
See step-by-step solutions with expert insights and AI powered tools for academic success
Step: 2

Step: 3
Ace Your Homework with AI
Get the answers you need in no time with our AI-driven, step-by-step assistance
Get Started
Advances In Databases 11th British National Conference On Databases Bncod 11 Keele Uk July 7 9 1993 Proceedings Lncs 696
Authors: Michael F. Worboys ,Anna F. Grundy
1993rd Edition
3540569219, 978-3540569213