Write the code in Python and use the Python Iris Dataset
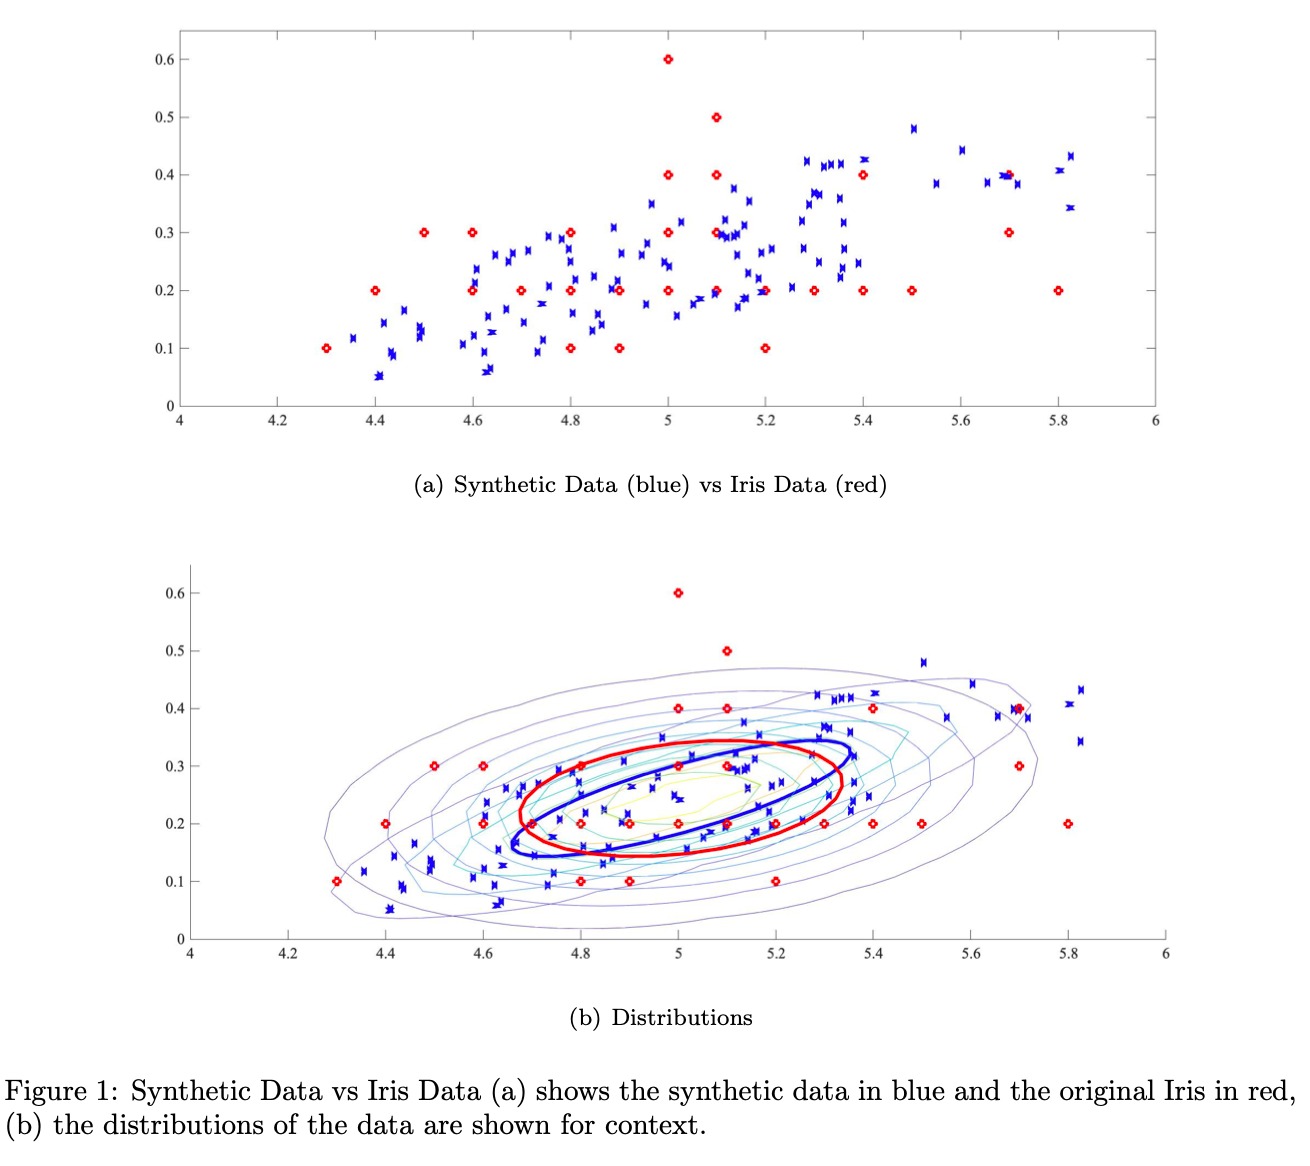
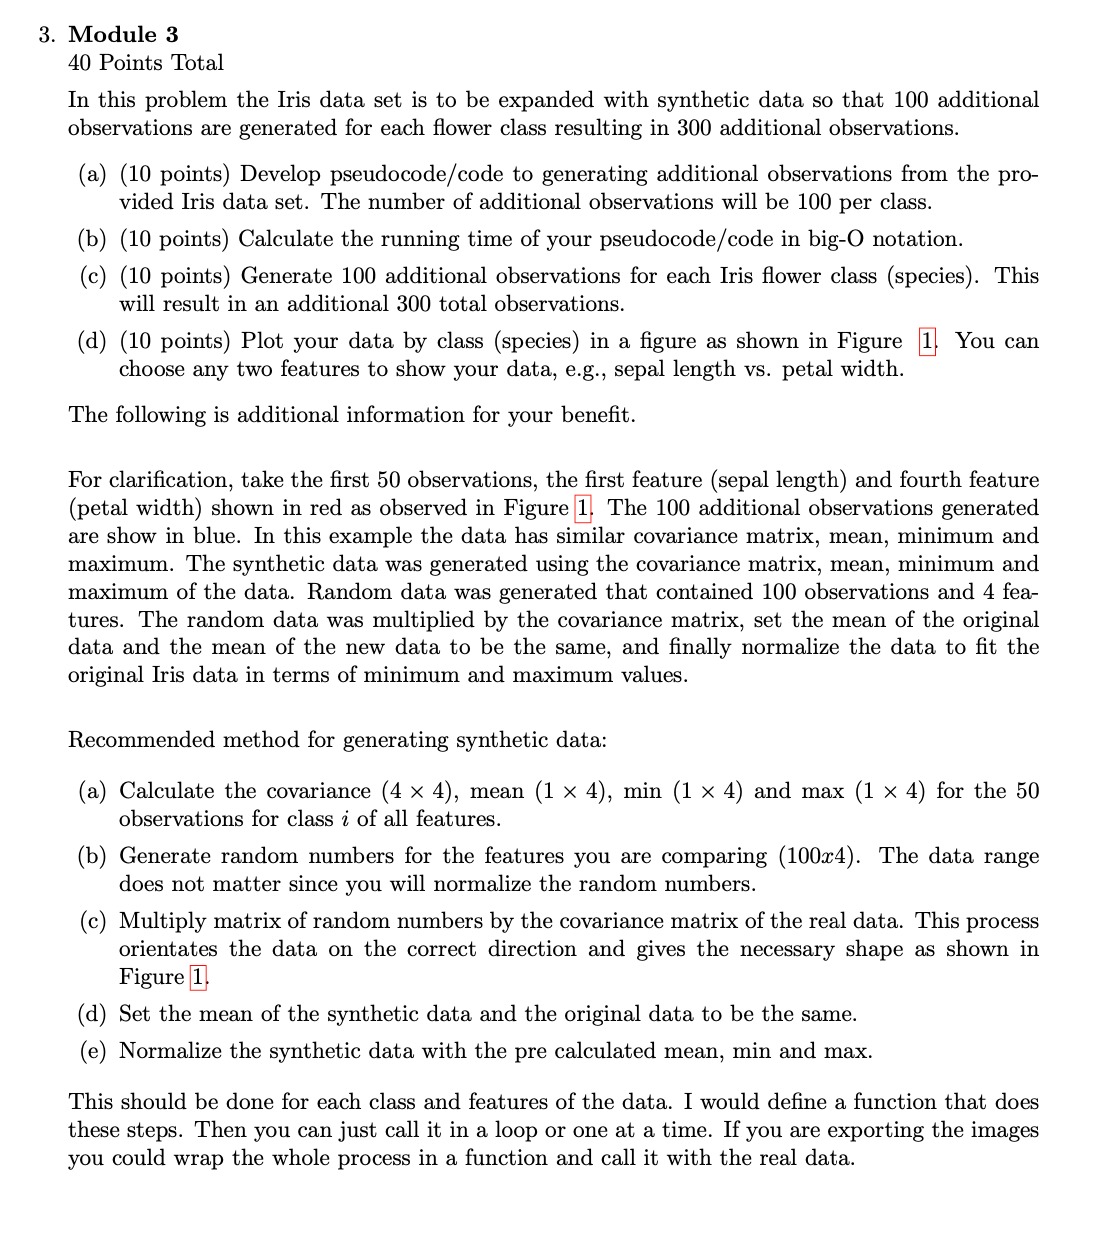
(a) Synthetic Date (blue) vs Iris Data. (red) 0.6 - O 0.5 0.4 0.3 - 0.2 0.1 - (b) Distributions Figure 1: Synthetic Data vs Iris Date (a) shows the synthetic data in blue and the original Iris in red, (b) the distributions of the data are shown for context. 3. Module 3 40 Points 'Ibtal In this problem the Iris data set is to be expanded with synthetic data so that 100 additional observations are generated for each ower class resulting in 300 additional observations. (a) (10 points) Develop pseudocode/code to generating additional observations from the pro- vided Iris data set. The number of additional observations will be 100 per class. (b) (10 points) Calculate the running time of your pseudocode/ code in big-O notation. (c) (10 points) Generate 100 additional observations for each Iris ower class (species). This will result in an additional 300 total observations. ((1) (10 points) Plot your data by class (species) in a gure as shown in Figure You can choose any two features to show your data, e.g., sepal length vs. petal width. The following is additional information for your benet. For clarication, take the rst 50 observations, the first feature (sepal length) and fourth feature (petal width) shown in red as observed in Figure The 100 additional observations generated are show in blue. In this example the data has similar covariance matrix, mean, minimum and maximum. The synthetic data was generated using the covariance matrix, mean, minimum and maximum of the data. Random data was generated that contained 100 observations and 4 fea- tures. The random data was multiplied by the covariance matrix, set the mean of the original data and the mean of the new data to be the same, and nally normalize the data to t the original Iris data in terms of minimum and maximum values. Recommended method for generating synthetic data: (a) Calculate the covariance (4 x 4), mean (1 x 4), min (1 x 4) and max (1 x 4) for the 50 observations for class 3' of all features. (b) Generate random numbers for the features you are comparing (100934). The data range does not matter since you will normalize the random numbers. (c) Multiply matrix of random numbers by the covariance matrix of the real data. This process orientates the data on the correct direction and gives the necessary shape as shown in Figure I} (d) Set the mean of the synthetic data and the original data to be the same. (e) Normalize the synthetic data with the pre calculated mean, min and max. This should be done for each class and features of the data. I would dene a function that does these steps. Then you can just call it in a loop or one at a time. If you are exporting the images you could wrap the whole process in a function and call it with the real data