

Question: Write the Graph Class The current 100 vertex limitation is due to the underlying implementation of an adjacency matrix. The rst step of the project
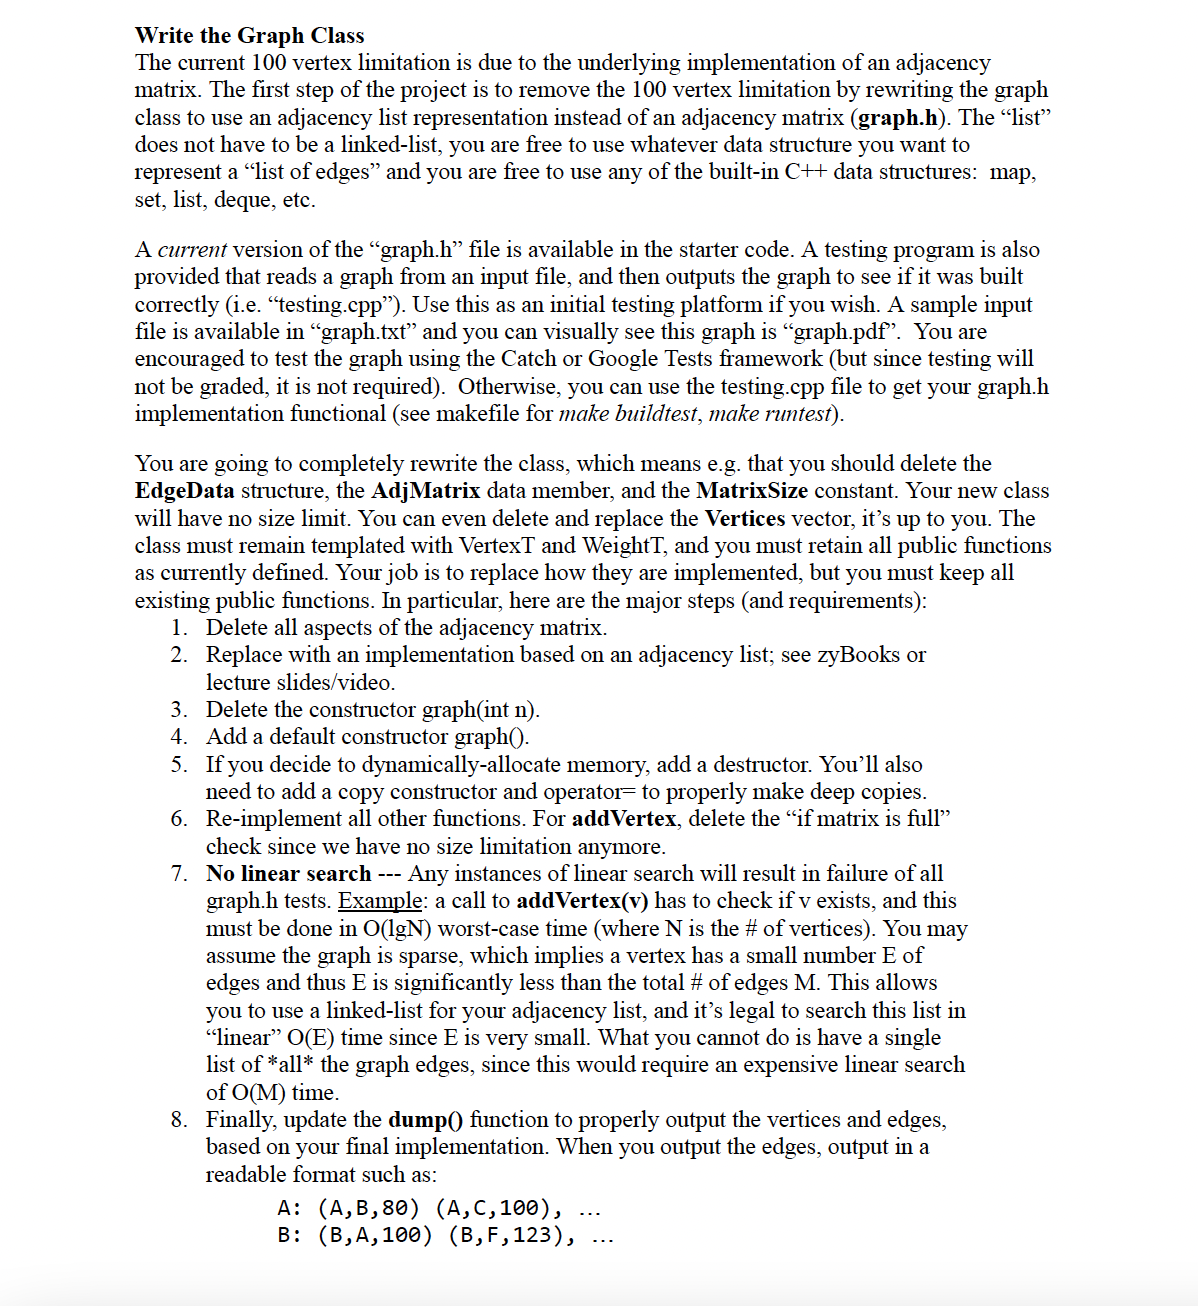
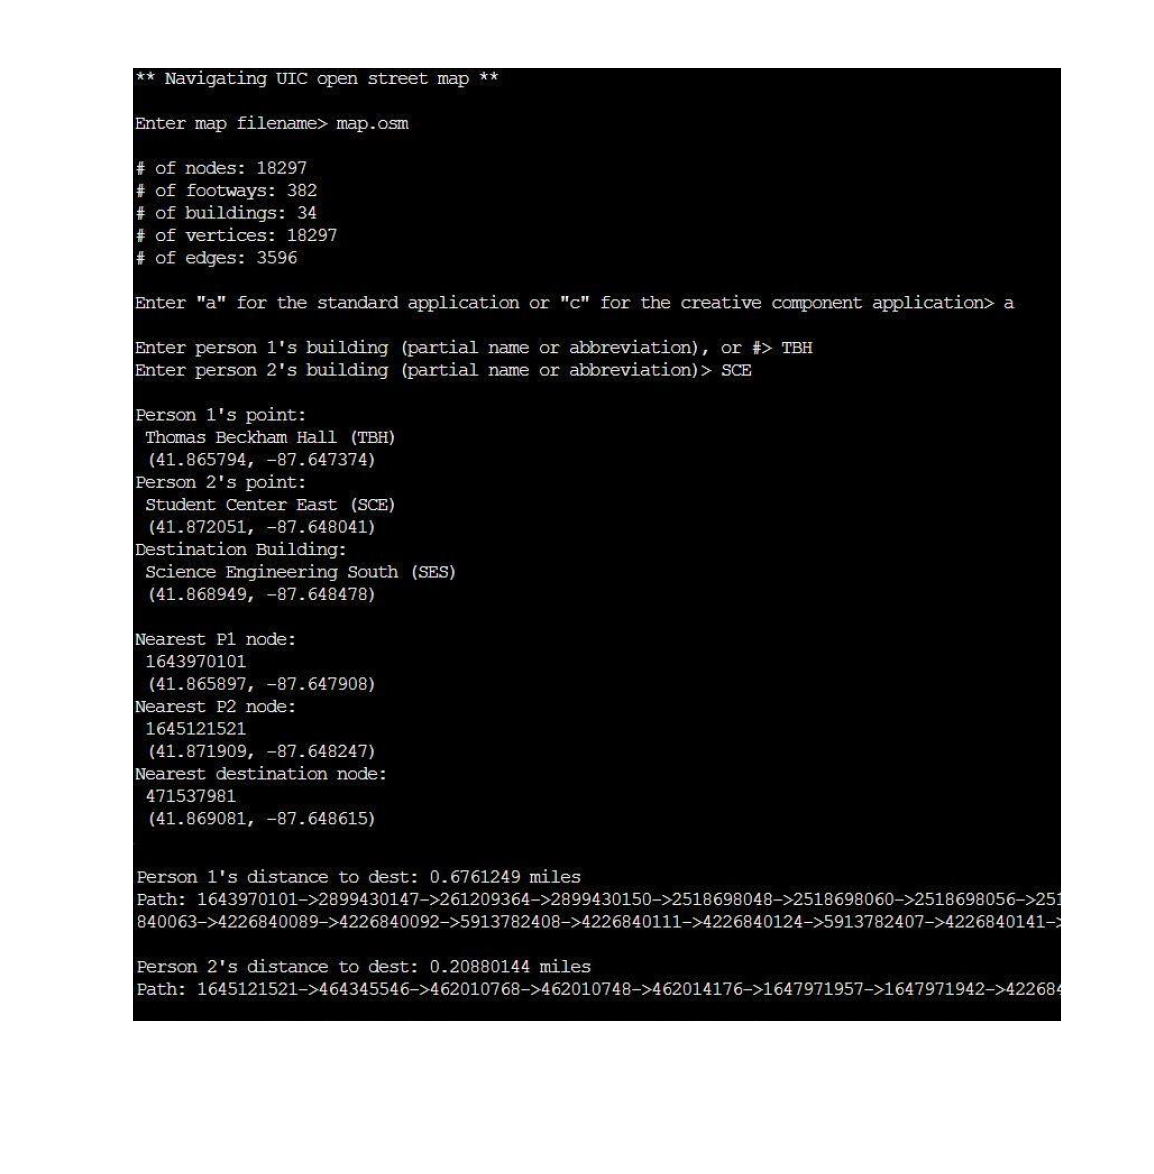
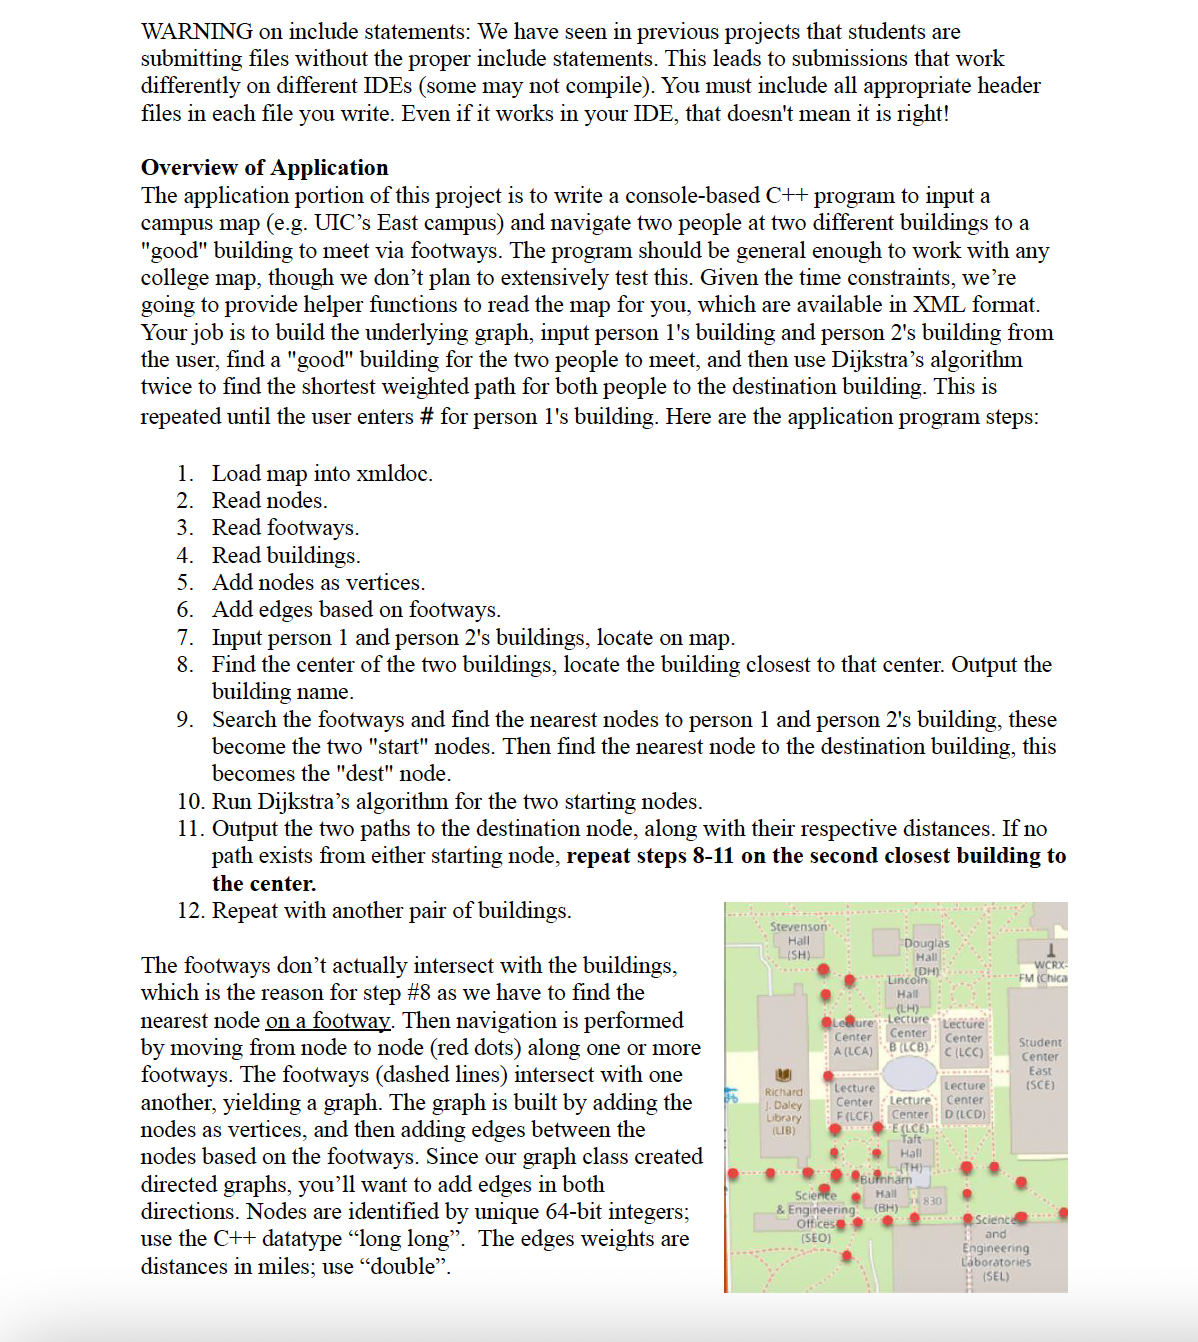
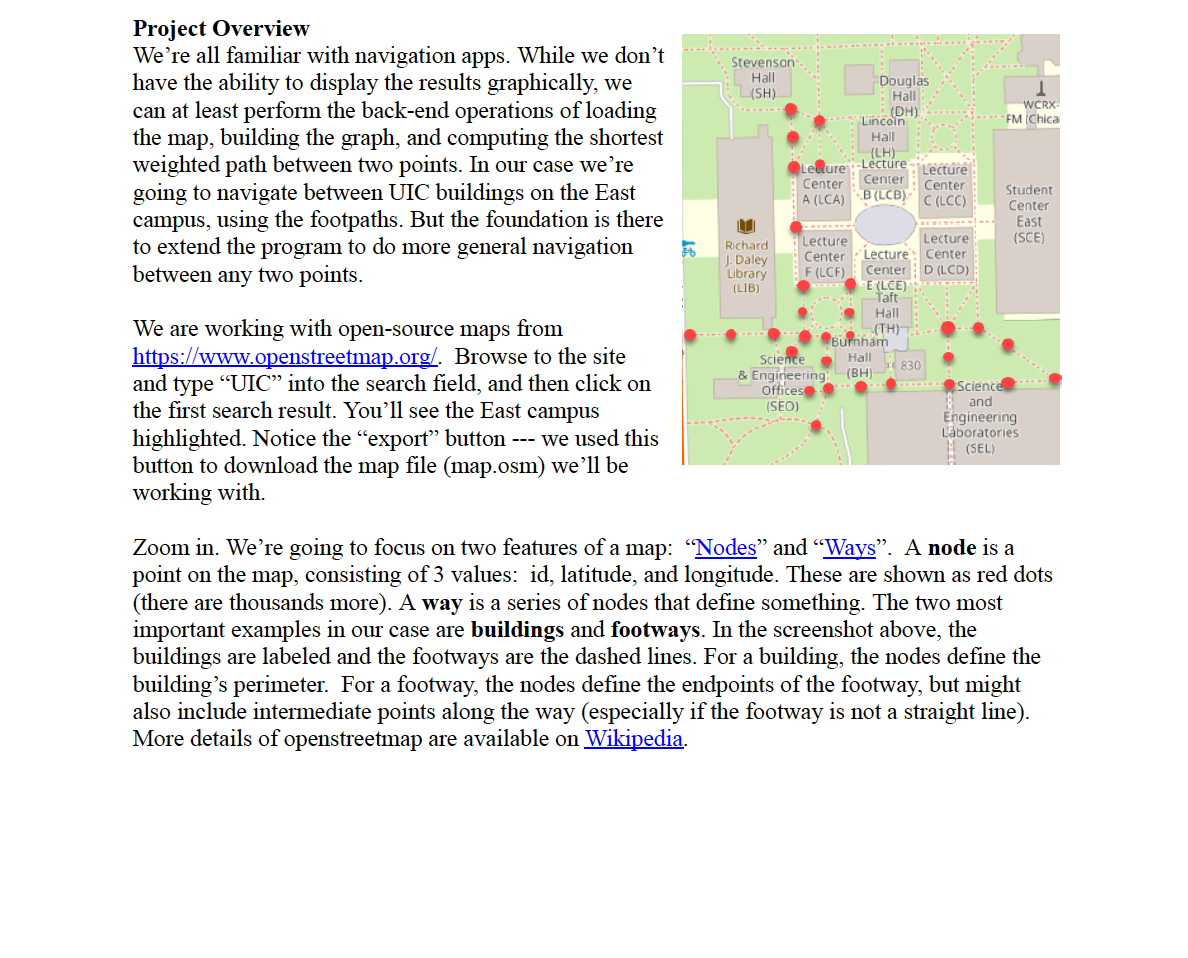
Write the Graph Class The current 100 vertex limitation is due to the underlying implementation of an adjacency matrix. The rst step of the project is to remove the 100 vertex limitation by rewriting the graph class to use an adjacency list representation instead of an adjacency matrix (graph.h). The \"list\" does not have to be a linked-list, you are free to use whatever data stlucture you want to represent a \"list of edges\" and you are free to use any of the built-in C-tt- data stluctures: map, set, list, deque, etc. A current version of the \"graph.h\" le is available in the starter code. A testing program is also provided that reads a graph from an input file, and then outputs the graph to see if it was built correctly (i.e. \"testing.cpp"). Use this as an initial testing platform if you wish. A sample input le is available in \"graphtxt\" and you can visually see this graph is \"graphpdf\". You are encouraged to test the graph using the Catch or Google Tests framework (but since testing will not be graded, it is not required). Otherwise, you can use the testing.cpp le to get your graph.h implementation functional (see makele for make buildtesf, make mates!) You are going to completely rewrite the class, which means e.g. that you should delete the EdgeData stlucture, the Adj Matrix data member, and the MatrixSize constant. Your new class will have no size limit. You can even delete and replace the Vertices vector, it's up to you. The class must remain templated with VertexT and WeightT, and you must retain all public functions as cun'ently dened. Your job is to replace how they are implemented, but you must keep all existing public functions. In particular, here are the major steps (and requirements): 1. Delete all aspects of the adjacency matrix. 2. Replace with an implementation based on an adjacency list: see zyBooks or lecture slidesfvideo. 3. Delete the constructor graph(int n). 4. Add a default constructor graph(). 5. If you decide to dynamically-allocate memory. add a destluctor. You'll also need to add a copy constructor and operat01= to properly make deep copies. 6. Re-implement all other functions. For addVerteX, delete the \"if matrix is full\" check since we have no size limitation anymore. 7. No linear search -- Any instances of linear search will result in failure of all graph.h tests. Example: a call to addVertex(v) has to check if v exists, and this must be done in 0(lgN) worst-case time (where N is the # of vertices). You may assume the graph is sparse, which implies a vertex has a small ninnber E of edges and thus E is signicantly less than the total # of edges M. This allows you to use a linked-list for your adjacency list, and it's legal to search this list in \"linear\" 0(E) time since E is very small. What you cannot do is have a single list of *all* the graph edges, since this would require an expensive linear search of OM time. 8. Finally, update the dump() function to properly output the vertices and edges, based on your nal implementation. When you output the edges, output in a readable format such as: A: (A,B,se) (A,c,1aa), B: (B,A,100) (B,F,123), ** Navigating UIC open street map ** Enter map filename> map. osm of nodes: 18297 of footways: 382 # of buildings: 34 of vertices: 18297 # of edges: 3596 Enter "a" for the standard application or "c" for the creative component application> a Enter person 1's building (partial name or abbreviation), or #> TBH Enter person 2's building (partial name or abbreviation)> SCE Person 1's point: Thomas Beckham Hall (TBH) (41.865794, -87.647374) Person 2's point: Student Center East (SCE) (41.872051, -87. 648041) Destination Building: Science Engineering South (SES) (41.868949, -87. 648478) Nearest P1 node: 1643970101 (41.865897, -87. 647908) Nearest P2 node: 1645121521 (41.871909, -87. 648247) Nearest destination node: 471537981 (41.869081, -87. 648615) Person 1's distance to dest: 0. 6761249 miles Path: 1643970101->2899430147->261209364->2899430150->2518698048->2518698060->2518698056->25 840063->4226840089->4226840092->5913782408->4226840111->4226840124->5913782407->4226840141- Person 2's distance to dest: 0.20880144 miles Path: 1645121521->464345546->462010768->462010748->462014176->1647971957->1647971942->42268WARNING on include statements: We have seen in previous projects that students are submitting les without the proper include statements. This leads to submissions that work differently on different lDEs (some may not compile). You must include all appropriate header les in each le you write. Even if it works in your IDE, that doesn't mean it is right! Overview of Application The application portion of this project is to write a console-based CH-l- program to input a campus map (e. g. UIC 's East campus) and navigate two people at two different buildings to a "good" building to meet via footways. The program should be general enough to work with any college map, though we don't plan to extensively test this. Given the time constraints, we're going to provide helper functions to read the map for you. which are available in XML format. Your job is to build the underlying graph, input person 1's building and person 2's building from the user, nd a "good" building for the two people to meet, and then use Dijkstra's algorithm twice to nd the shortest weighted path for both people to the destination building. This is repeated until the user enters # for person 1's building. Here are the application program steps: Load map into Xinldoc. Read nodes. Read footways. Read buildings. Add nodes as vertices. Add edges based on footways. Input person 1 and person 2's buildings, locate on map. Find the center of the two buildings, locate the building closest to that center. Output the building name. Search the footways and nd the nearest nodes to person 1 and person 2's building, these become the two "start" nodes. Then nd the nearest node to the destination building, this becomes the "dest" node. 10. R1111 Dijkstra 's algorithm for the two starting nodes. 11. Output the two paths to the destination node, along with their respective distances. If no path exists from either stalting node, repeat steps 8-11 on the second closest building to the center. 12. Repeat with another pair of buildings. POTJP'WFP'P?' 5 I o ..| . The footways don't actually intersect with the buildings, ' Hi . .';'_;.',- \"grit-- which is the reason for step #8 as we have to nd the o p Lem i IL I? nearest node on a footway. Then navigation is performed Imam- I4 by moving from node to node (red dots) along one or more Lilli. I" 5.135. footways. The footways (dashed lines) intersect with one _ . U r . (iffy, another, yielding a graph. The graph is built by adding the F r"-Z".l',". nodes as vertices, and then adding edges between the ; ..'.'.-. ' O nodes based on the footways. Since our graph class created ' ' ' j . . directed graphs, you'll want to add edges in both . . ... ... :t'fj" . I directions. Nodes are identied by unique 64-bit integers; *'lfl:"'flzjjl'; 'r. '2 , I" I use the C++ datatype \"long long\". The edges weights are -L'-'= . , distances in miles; use \"double\". Project Overview We're all familiar with navigation apps. While we don't - - 4. .. . Stevenson have the ability to display the results graphically, we Hall Douglas (SH) : Hall can at least perform the back-end operations of loading WCRX Lincoln (DH) ....".. .. - FM Chica the map, building the graph, and computing the shortest Hall (LH) weighted path between two points. In our case we're LeQure - Lecture - Lecture Center going to navigate between UIC buildings on the East Center : Center A (LCA) B (LCB)- Student C (LCC) Center campus, using the footpaths. But the foundation is there East to extend the program to do more general navigation Richard Lecture Lecture (SCE) J. Daley Center Lecture : Center between any two points. Library F (LCF) Center : D (LCD) (LIB) -E (LCE) ... .- Taft Hall We are working with open-source maps from (TH).. Burnham https:/www.openstreetmap.org. Browse to the site Science Hall 830 & Engineering! (BH) and type "UIC" into the search field, and then click on Offices. ...Science the first search result. You'll see the East campus (SEO) and Engineering highlighted. Notice the "export" button --- we used this Laboratories (SEL) button to download the map file (map.osm) we'll be working with. Zoom in. We're going to focus on two features of a map: "Nodes" and "Ways". A node is a point on the map, consisting of 3 values: id, latitude, and longitude. These are shown as red dots (there are thousands more). A way is a series of nodes that define something. The two most important examples in our case are buildings and footways. In the screenshot above, the buildings are labeled and the footways are the dashed lines. For a building, the nodes define the building's perimeter. For a footway, the nodes define the endpoints of the footway, but might also include intermediate points along the way (especially if the footway is not a straight line). More details of openstreetmap are available on Wikipedia
Step by Step Solution
There are 3 Steps involved in it

Get step-by-step solutions from verified subject matter experts