Answered step by step
Verified Expert Solution
Question
1 Approved Answer
A bakery store employs workers (W) and cake machines (M) to produce cake according to following production 1 2 function: Q(M,W)=MW. The hourly cost

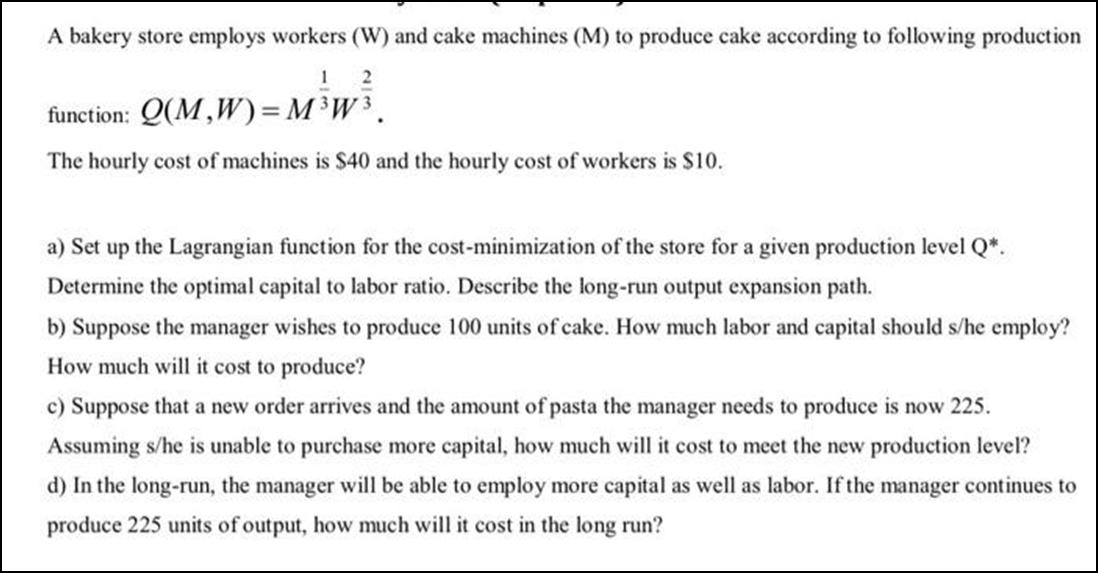
A bakery store employs workers (W) and cake machines (M) to produce cake according to following production 1 2 function: Q(M,W)=MW. The hourly cost of machines is $40 and the hourly cost of workers is $10. a) Set up the Lagrangian function for the cost-minimization of the store for a given production level Q*. Determine the optimal capital to labor ratio. Describe the long-run output expansion path. b) Suppose the manager wishes to produce 100 units of cake. How much labor and capital should s/he employ? How much will it cost to produce? c) Suppose that a new order arrives and the amount of pasta the manager needs to produce is now 225. Assuming s/he is unable to purchase more capital, how much will it cost to meet the new production level? d) In the long-run, the manager will be able to employ more capital as well as labor. If the manager continues to produce 225 units of output, how much will it cost in the long run?
Step by Step Solution
★★★★★
3.44 Rating (157 Votes )
There are 3 Steps involved in it
Step: 1

Get Instant Access to Expert-Tailored Solutions
See step-by-step solutions with expert insights and AI powered tools for academic success
Step: 2

Step: 3

Ace Your Homework with AI
Get the answers you need in no time with our AI-driven, step-by-step assistance
Get Started


