Question: Write the same query as #2 but use LEFT JOINS using the PEOPLE table first. This time, sort by salary in descending order and
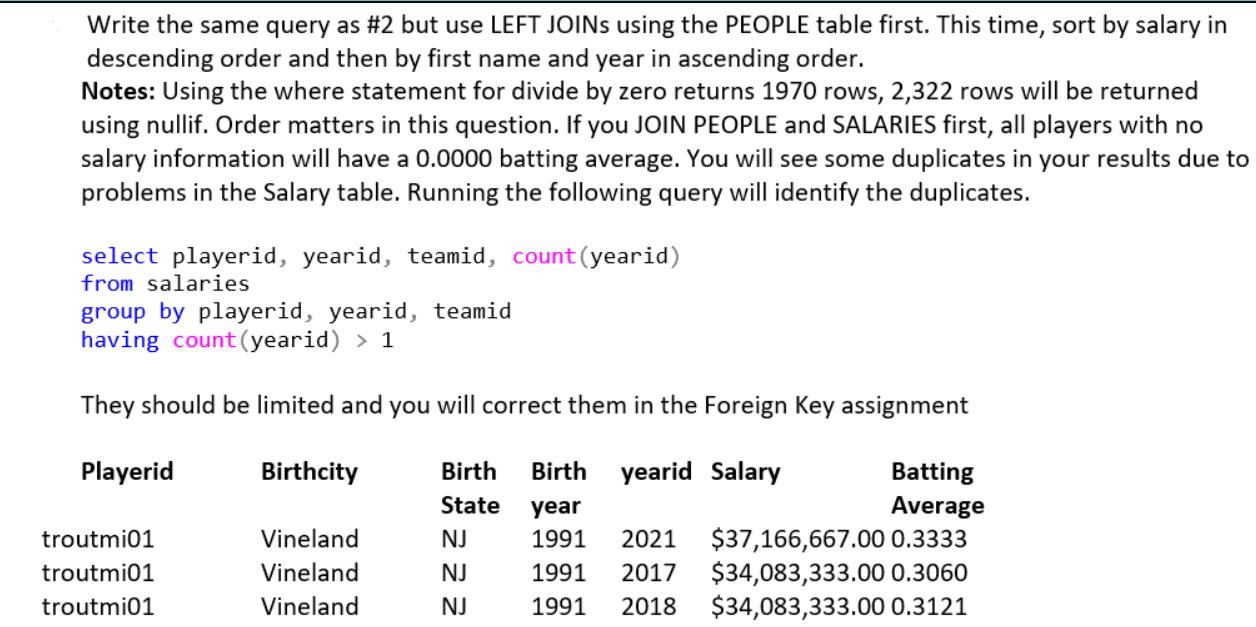
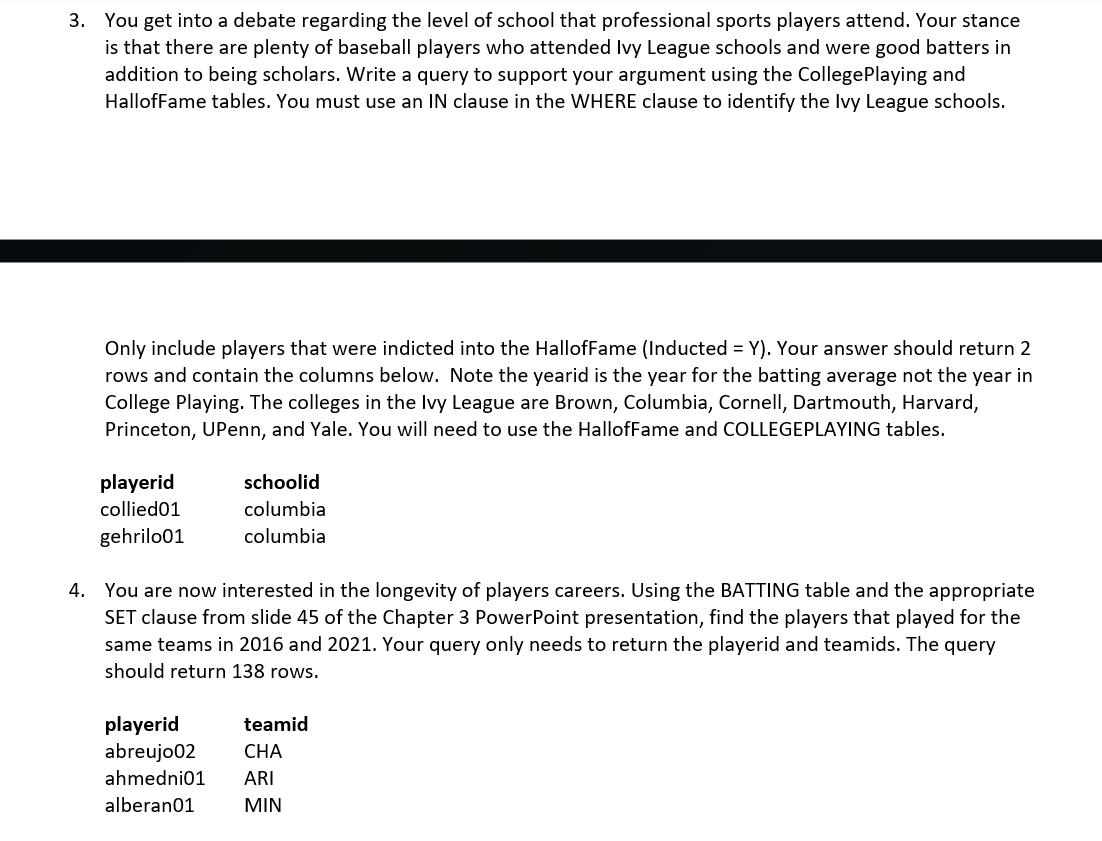
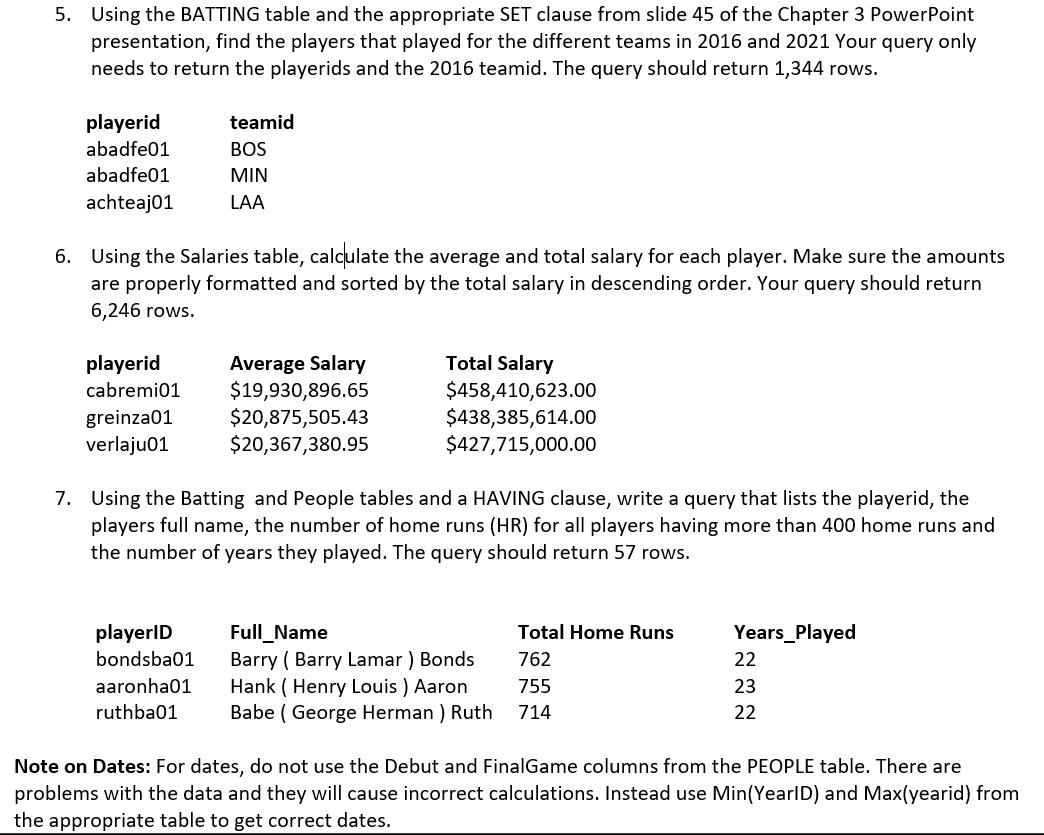
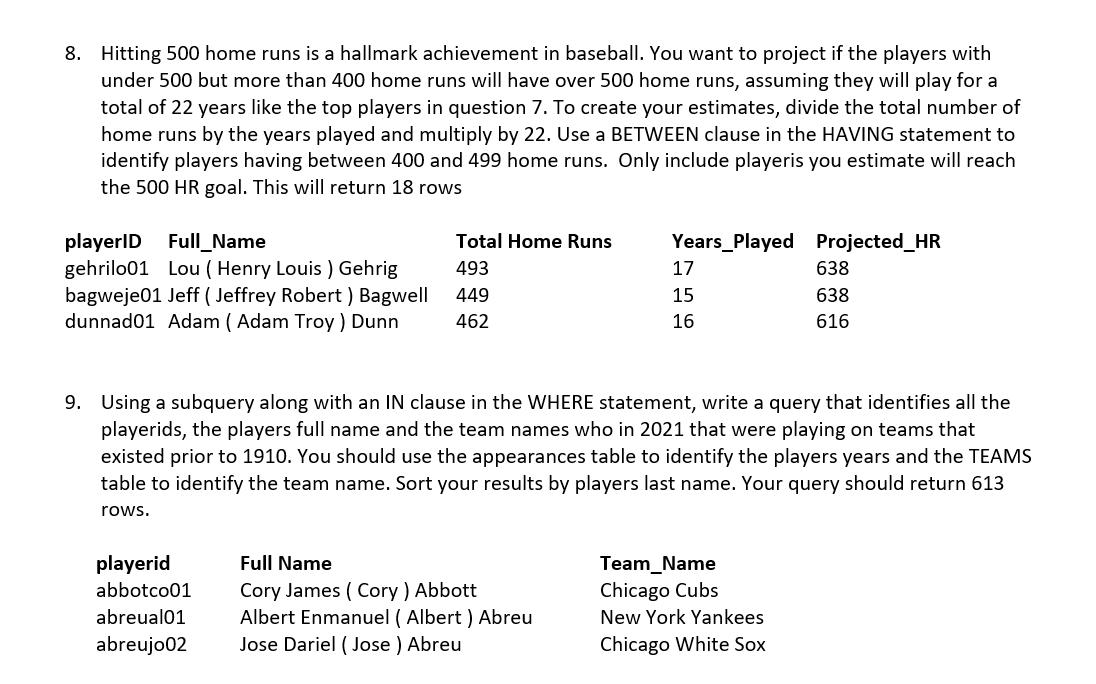
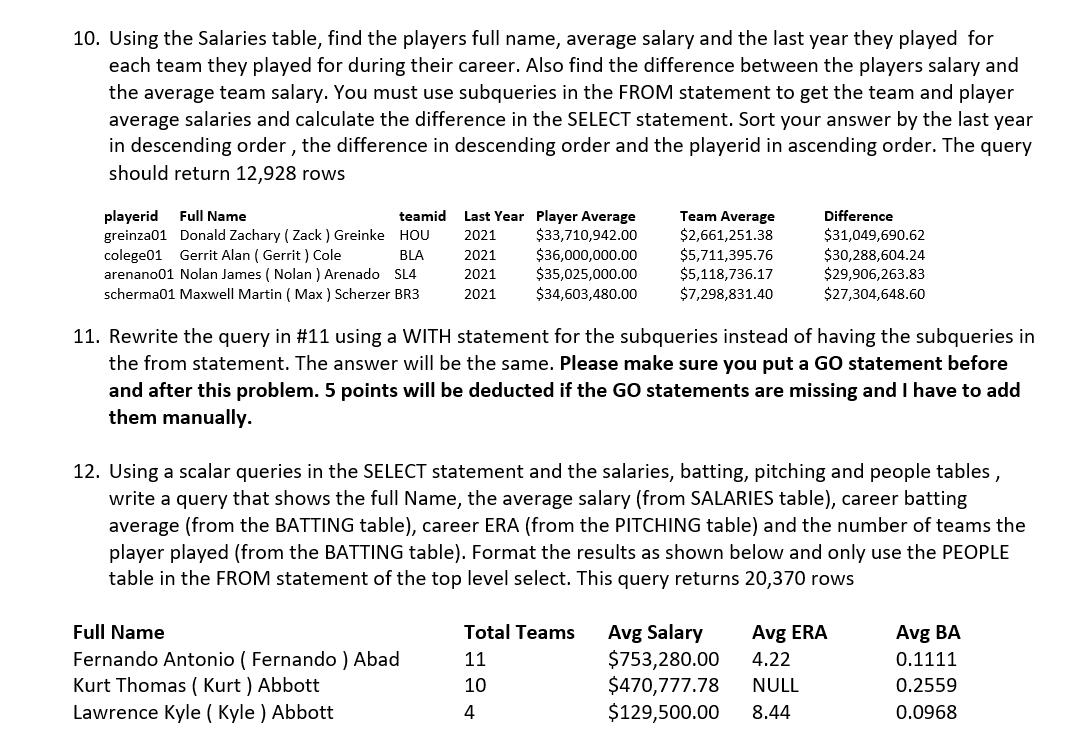
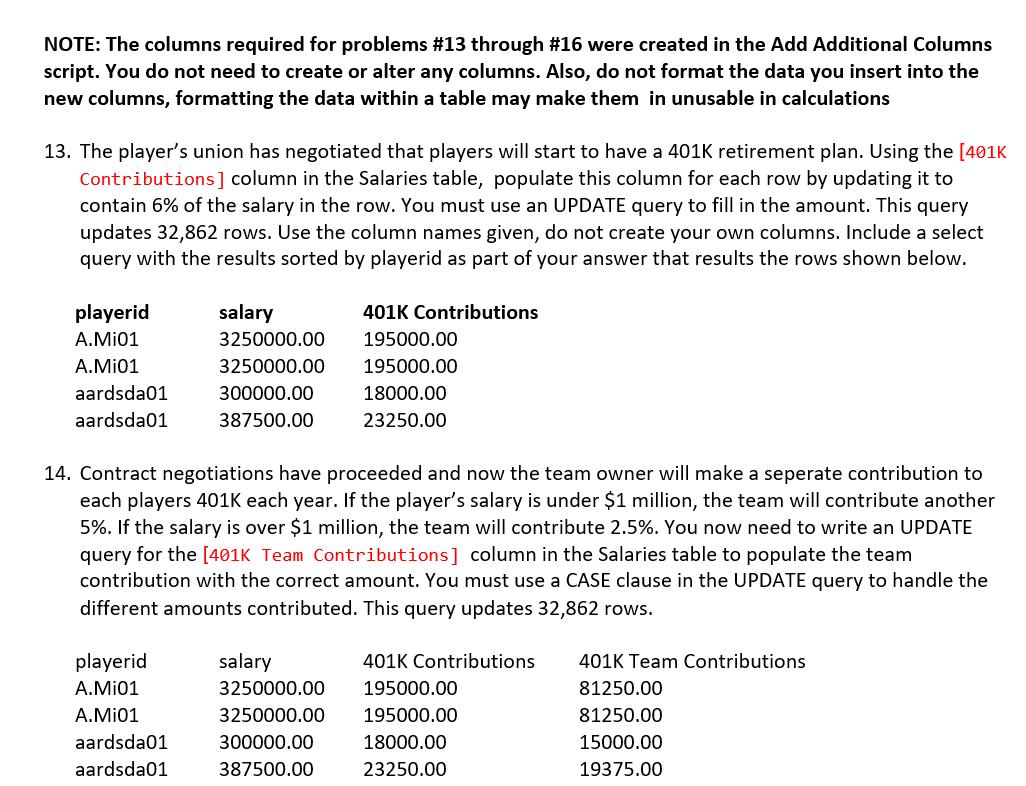
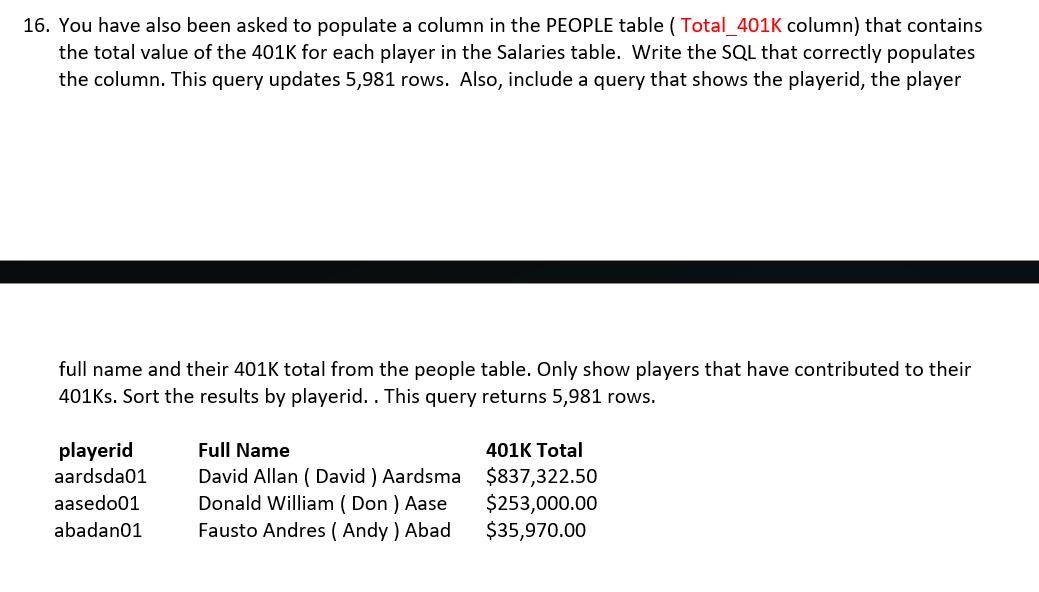
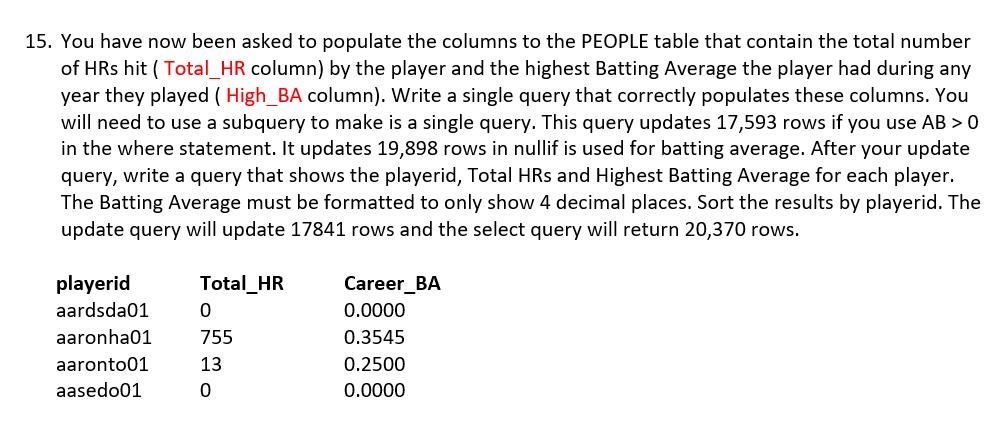
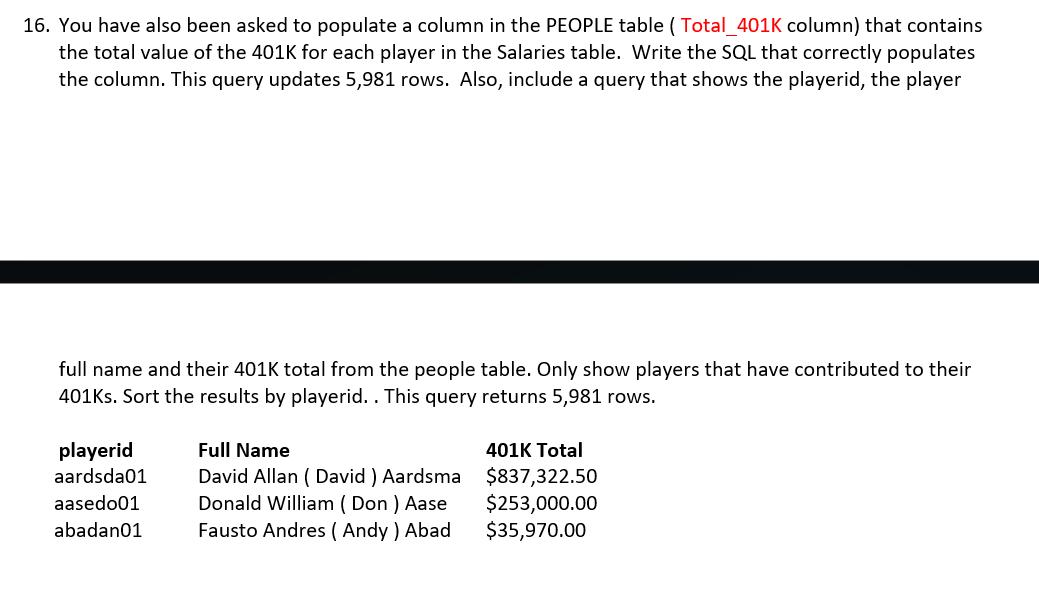
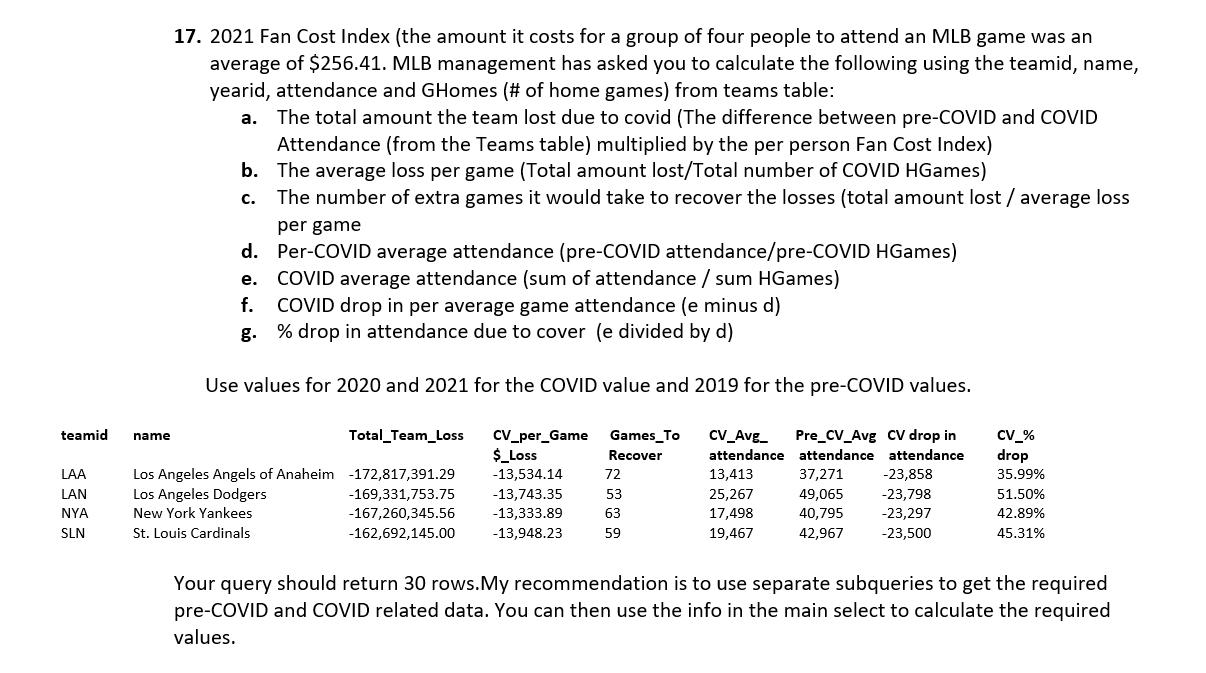
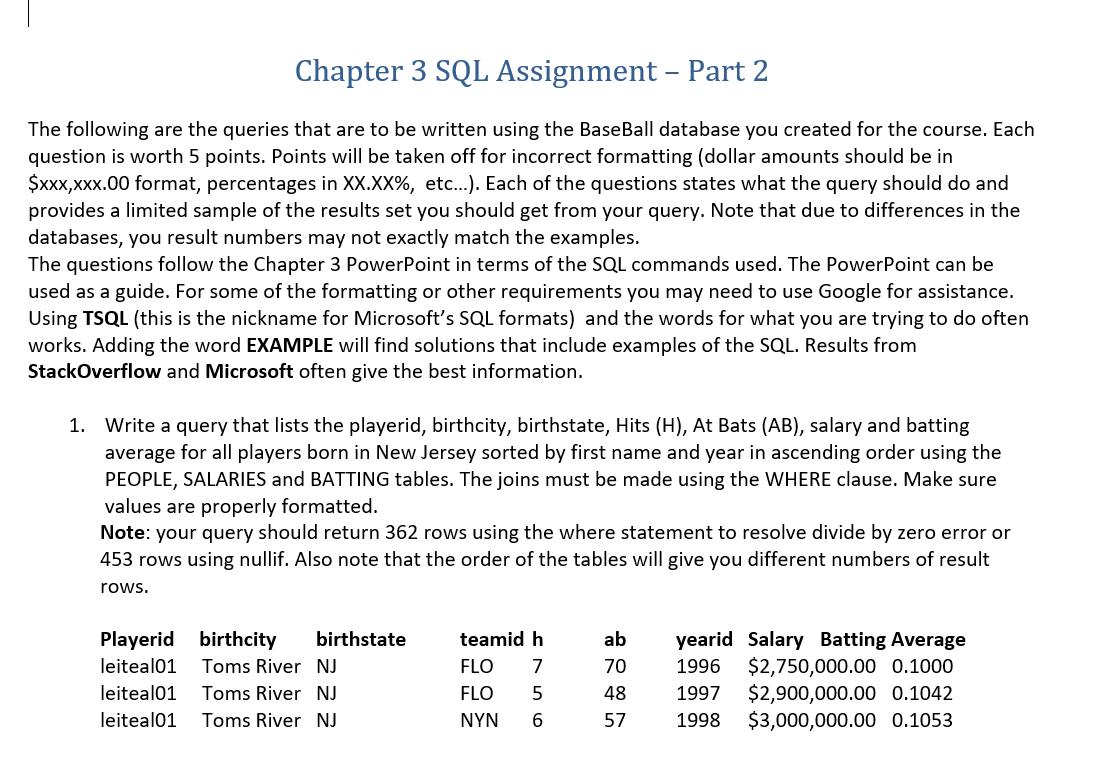
Write the same query as #2 but use LEFT JOINS using the PEOPLE table first. This time, sort by salary in descending order and then by first name and year in ascending order. Notes: Using the where statement for divide by zero returns 1970 rows, 2,322 rows will be returned using nullif. Order matters in this question. If you JOIN PEOPLE and SALARIES first, all players with no salary information will have a 0.0000 batting average. You will see some duplicates in your results due to problems in the Salary table. Running the following query will identify the duplicates. select playerid, yearid, teamid, count (yearid) from salaries group by playerid, yearid, teamid having count(yearid) > 1 They should be limited and you will correct them in the Foreign Key assignment Playerid Birthcity Birth Birth yearid Salary State troutmi01 troutmi01 troutmi01 Vineland Vineland Vineland NJ NJ NJ year 1991 2021 1991 2017 1991 2018 Batting Average $37,166,667.00 0.3333 $34,083,333.00 0.3060 $34,083,333.00 0.3121 3. You get into a debate regarding the level of school that professional sports players attend. Your stance is that there are plenty of baseball players who attended Ivy League schools and were good batters in addition to being scholars. Write a query to support your argument using the College Playing and Halloffame tables. You must use an IN clause in the WHERE clause to identify the Ivy League schools. Only include players that were indicted into the HallofFame (Inducted = Y). Your answer should return 2 rows and contain the columns below. Note the yearid is the year for the batting average not the year in College Playing. The colleges in the Ivy League are Brown, Columbia, Cornell, Dartmouth, Harvard, Princeton, UPenn, and Yale. You will need to use the Halloffame and COLLEGEPLAYING tables. playerid collied01 gehrilo01 schoolid columbia columbia 4. You are now interested in the longevity of players careers. Using the BATTING table and the appropriate SET clause from slide 45 of the Chapter 3 PowerPoint presentation, find the players that played for the same teams in 2016 and 2021. Your query only needs to return the playerid and teamids. The query should return 138 rows. teamid playerid abreujo02 CHA ahmedni01 ARI alberan01 MIN 5. Using the BATTING table and the appropriate SET clause from slide 45 of the Chapter 3 PowerPoint presentation, find the players that played for the different teams in 2016 and 2021 Your query only needs to return the playerids and the 2016 teamid. The query should return 1,344 rows. playerid abadfe01 abadfe01 achteaj01 6. Using the Salaries table, calculate the average and total salary for each player. Make sure the amounts are properly formatted and sorted by the total salary in descending order. Your query should return 6,246 rows. playerid cabremi01 greinza01 verlaju01 teamid BOS MIN LAA playerID bondsba01 aaronha01 ruthba01 Average Salary $19,930,896.65 $20,875,505.43 $20,367,380.95 Total Salary $458,410,623.00 $438,385,614.00 $427,715,000.00 7. Using the Batting and People tables and a HAVING clause, write a query that lists the playerid, the players full name, the number of home runs (HR) for all players having more than 400 home runs and the number of years they played. The query should return 57 rows. Full Name Barry (Barry Lamar) Bonds Hank (Henry Louis) Aaron Babe ( George Herman ) Ruth Total Home Runs 762 755 714 Years_Played 22 23 22 Note on Dates: For dates, do not use the Debut and FinalGame columns from the PEOPLE table. There are problems with the data and they will cause incorrect calculations. Instead use Min(YearID) and Max(yearid) from the appropriate table to get correct dates. 8. Hitting 500 home runs is a hallmark achievement in baseball. You want to project if the players with under 500 but more than 400 home runs will have over 500 home runs, assuming they will play for a total of 22 years like the top players in question 7. To create your estimates, divide the total number of home runs by the years played and multiply by 22. Use a BETWEEN clause in the HAVING statement to identify players having between 400 and 499 home runs. Only include playeris you estimate will reach the 500 HR goal. This will return 18 rows playerID Full Name gehrilo01 Lou (Henry Louis) Gehrig bagweje01 Jeff (Jeffrey Robert) Bagwell dunnad01 Adam (Adam Troy) Dunn Total Home Runs 493 449 462 playerid abbotco01 Full Name Cory James (Cory) Abbott abreual01 Albert Enmanuel ( Albert) Abreu abreujo02 Jose Dariel (Jose) Abreu Years Played Projected_HR 17 15 16 9. Using a subquery along with an IN clause in the WHERE statement, write a query that identifies all the playerids, the players full name and the team names who in 2021 that were playing on teams that existed prior to 1910. You should use the appearances table to identify the players years and the TEAMS table to identify the team name. Sort your results by players last name. Your query should return 613 rows. 638 638 616 Team_Name Chicago Cubs New York Yankees Chicago White Sox 10. Using the Salaries table, find the players full name, average salary and the last year they played for each team they played for during their career. Also find the difference between the players salary and the average team salary. You must use subqueries in the FROM statement to get the team and player average salaries and calculate the difference in the SELECT statement. Sort your answer by the last year in descending order, the difference in descending order and the playerid in ascending order. The query should return 12,928 rows playerid Full Name teamid greinza01 Donald Zachary (Zack) Greinke HOU colege01 Gerrit Alan (Gerrit) Cole BLA arenano01 Nolan James (Nolan) Arenado SL4 scherma01 Maxwell Martin (Max) Scherzer BR3 Last Year Player Average 2021 $33,710,942.00 2021 $36,000,000.00 2021 $35,025,000.00 2021 $34,603,480.00 Full Name Fernando Antonio (Fernando ) Abad Kurt Thomas (Kurt ) Abbott Lawrence Kyle (Kyle) Abbott Team Average $2,661,251.38 $5,711,395.76 $5,118,736.17 $7,298,831.40 11. Rewrite the query in #11 using a WITH statement for the subqueries instead of having the subqueries in the from statement. The answer will be the same. Please make sure you put a GO statement before and after this problem. 5 points will be deducted if the GO statements are missing and I have to add them manually. 12. Using a scalar queries in the SELECT statement and the salaries, batting, pitching and people tables, write a query that shows the full Name, the average salary (from SALARIES table), career batting average (from the BATTING table), career ERA (from the PITCHING table) and the number of teams the player played (from the BATTING table). Format the results as shown below and only use the PEOPLE table in the FROM statement of the top level select. This query returns 20,370 rows Total Teams 11 10 4 Difference $31,049,690.62 $30,288,604.24 $29,906,263.83 $27,304,648.60 Avg Salary $753,280.00 $470,777.78 NULL $129,500.00 8.44 Avg ERA 4.22 Avg BA 0.1111 0.2559 0.0968 NOTE: The columns required for problems #13 through #16 were created in the Add Additional Columns script. You do not need to create or alter any columns. Also, do not format the data you insert into the new columns, formatting the data within a table may make them in unusable in calculations 13. The player's union has negotiated that players will start to have a 401k retirement plan. Using the [401K Contributions] column in the Salaries table, populate this column for each row by updating it to contain 6% of the salary in the row. You must use an UPDATE query to fill in the amount. This query updates 32,862 rows. Use the column names given, do not create your own columns. Include a select query with the results sorted by playerid as part of your answer that results the rows shown below. playerid A.Mi01 A.Mi01 aardsda01 aardsda01 playerid A.Mi01 A.Mi01 salary 3250000.00 3250000.00 300000.00 387500.00 14. Contract negotiations have proceeded and now the team owner will make a seperate contribution to each players 401K each year. If the player's salary is under $1 million, the team will contribute another 5%. If the salary is over $1 million, the team will contribute 2.5%. You now need to write an UPDATE query for the [401K Team Contributions] column in the Salaries table to populate the team contribution with the correct amount. You must use a CASE clause in the UPDATE query to handle the different amounts contributed. This query updates 32,862 rows. aardsda01 aardsda01 401K Contributions 195000.00 195000.00 18000.00 23250.00 salary 3250000.00 3250000.00 300000.00 387500.00 401K Contributions 195000.00 195000.00 18000.00 23250.00 401K Team Contributions 81250.00 81250.00 15000.00 19375.00 16. You have also been asked to populate a column in the PEOPLE table (Total_401K column) that contains the total value of the 401K for each player in the Salaries table. Write the SQL that correctly populates the column. This query updates 5,981 rows. Also, include a query that shows the playerid, the player full name and their 401K total from the people table. Only show players that have contributed to their 401Ks. Sort the results by playerid.. This query returns 5,981 rows. playerid aardsda01 aasedo01 abadan01 Full Name David Allan (David) Aardsma Donald William (Don) Aase Fausto Andres (Andy ) Abad 401K Total $837,322.50 $253,000.00 $35,970.00 15. You have now been asked to populate the columns to the PEOPLE table that contain the total number of HRs hit (Total_HR column) by the player and the highest Batting Average the player had during any year they played (High_BA column). Write a single query that correctly populates these columns. You will need to use a subquery to make is a single query. This query updates 17,593 rows if you use AB > 0 in the where statement. It updates 19,898 rows in nullif is used for batting average. After your update query, write a query that shows the playerid, Total HRs and Highest Batting Average for each player. The Batting Average must be formatted to only show 4 decimal places. Sort the results by playerid. The update query will update 17841 rows and the select query will return 20,370 rows. playerid aardsda01 aaronha01 aaronto01 aasedo01 Total_HR 0 755 13 0 Career_BA 0.0000 0.3545 0.2500 0.0000 16. You have also been asked to populate a column in the PEOPLE table (Total_401K column) that contains the total value of the 401K for each player in the Salaries table. Write the SQL that correctly populates the column. This query updates 5,981 rows. Also, include a query that shows the playerid, the player full name and their 401K total from the people table. Only show players that have contributed to their 401Ks. Sort the results by playerid.. This query returns 5,981 rows. playerid aardsda01 aasedo01 abadan01 Full Name David Allan (David) Aardsma Donald William (Don) Aase Fausto Andres (Andy) Abad 401K Total $837,322.50 $253,000.00 $35,970.00 teamid LAA LAN NYA SLN 17. 2021 Fan Cost Index (the amount it costs for a group of four people to attend an MLB game was an average of $256.41. MLB management has asked you to calculate the following using the teamid, name, yearid, attendance and GHomes (# of home games) from teams table: a. The total amount the team lost due to covid (The difference between pre-COVID and COVID Attendance (from the Teams table) multiplied by the per person Fan Cost Index) b. The average loss per game (Total amount lost/Total number of COVID HGames) C. The number of extra games it would take to recover the losses (total amount lost / average loss name per game d. Per-COVID average attendance (pre-COVID attendance/pre-COVID HGames) e. COVID average attendance (sum of attendance / sum HGames) f. COVID drop in per average game attendance (e minus d) g. % drop in attendance due to cover (e divided by d) Use values for 2020 and 2021 for the COVID value and 2019 for the pre-COVID values. Recover Games_To CV_Avg_ Pre_CV_Avg CV drop in attendance attendance attendance 13,413 37,271 -23,858 25,267 49,065 -23,798 17,498 40,795 -23,297 19,467 42,967 -23,500 Total_Team_Loss Los Angeles Angels of Anaheim -172,817,391.29 Los Angeles Dodgers. New York Yankees -169,331,753.75 -167,260,345.56 -162,692,145.00 St. Louis Cardinals CV_per_Game $_Loss -13,534.14 -13,743.35 -13,333.89 -13,948.23 72 53 63 59 CV_% drop 35.99% 51.50% 42.89% 45.31% Your query should return 30 rows. My recommendation is to use separate subqueries to get the required pre-COVID and COVID related data. You can then use the info in the main select to calculate the required values. Chapter 3 SQL Assignment - Part 2 The following are the queries that are to be written using the BaseBall database you created for the course. Each question is worth 5 points. Points will be taken off for incorrect formatting (dollar amounts should be in $xxx,xxx.00 format, percentages in XX.XX%, etc...). Each of the questions states what the query should do and provides a limited sample of the results set you should get from your query. Note that due to differences in the databases, you result numbers may not exactly match the examples. The questions follow the Chapter 3 PowerPoint in terms of the SQL commands used. The PowerPoint can be used as a guide. For some of the formatting or other requirements you may need to use Google for assistance. Using TSQL (this is the nickname for Microsoft's SQL formats) and the words for what you are trying to do often works. Adding the word EXAMPLE will find solutions that include examples of the SQL. Results from Stack Overflow and Microsoft often give the best information. 1. Write a query that lists the playerid, birthcity, birthstate, Hits (H), At Bats (AB), salary and batting average for all players born in New Jersey sorted by first name and year in ascending order using the PEOPLE, SALARIES and BATTING tables. The joins must be made using the WHERE clause. Make sure values are properly formatted. Note: your query should return 362 rows using the where statement to resolve divide by zero error or 453 rows using nullif. Also note that the order of the tables will give you different numbers of result rows. Playerid birthcity birthstate leiteal01 Toms River NJ leiteal01 Toms River NJ leiteal01 Toms River NJ teamid h FLO FLO NYN 756 ab 70 48 57 yearid Salary Batting Average 1996 $2,750,000.00 0.1000 1997 1998 $2,900,000.00 0.1042 $3,000,000.00 0.1053
Step by Step Solution
There are 3 Steps involved in it
Answer SELECT Pplayerid Pbirthcity Pbirthstate Pbirthyear ... View full answer

Get step-by-step solutions from verified subject matter experts


