

Question: Wrote a WebGL program that displays the graph of a bivariate function: z = f (x, y) for (x,y) in D=[0,1]x[0,1]. f(x, y) =
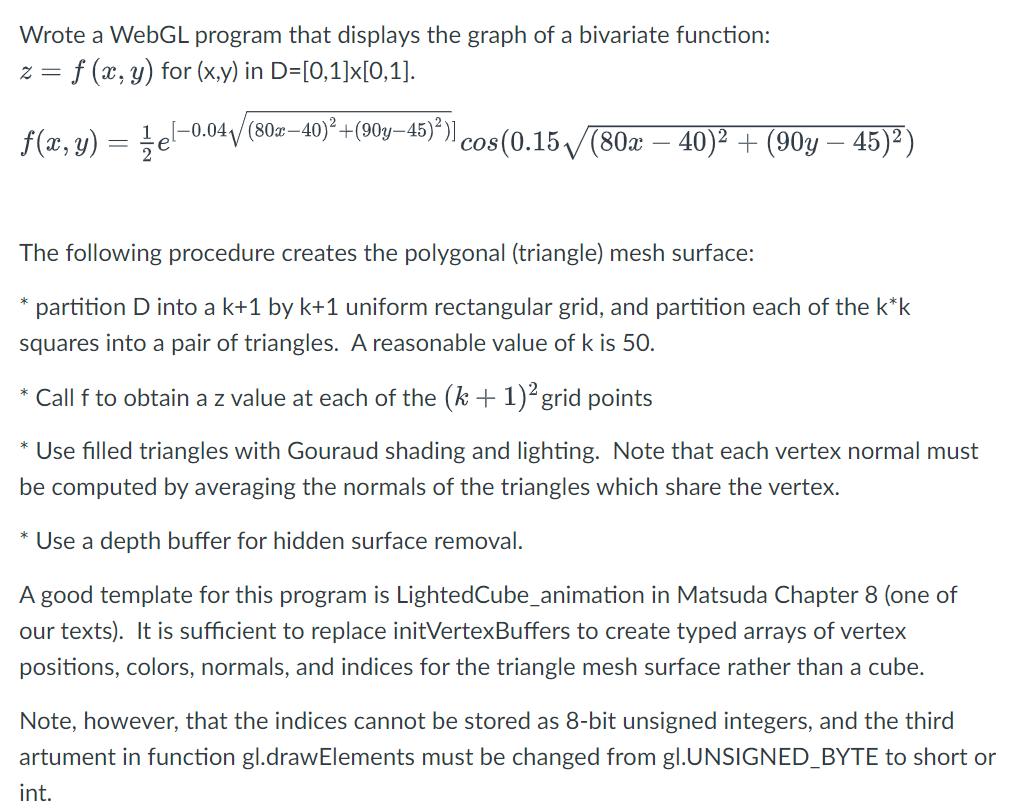
Wrote a WebGL program that displays the graph of a bivariate function: z = f (x, y) for (x,y) in D=[0,1]x[0,1]. f(x, y) = el-0.04(80a-40)+(90y-45))) cos(0.15(80x 40) + (90y 45)) The following procedure creates the polygonal (triangle) mesh surface: partition D into a k+1 by k+1 uniform rectangular grid, and partition each of the k*k squares into a pair of triangles. A reasonable value of k is 50. Call f to obtain a z value at each of the (k+ 1)2 grid points * * Use filled triangles with Gouraud shading and lighting. Note that each vertex normal must be computed by averaging the normals of the triangles which share the vertex. * Use a depth buffer for hidden surface removal. A good template for this program is LightedCube_animation in Matsuda Chapter 8 (one of our texts). It is sufficient to replace initVertexBuffers to create typed arrays of vertex positions, colors, normals, and indices for the triangle mesh surface rather than a cube. Note, however, that the indices cannot be stored as 8-bit unsigned integers, and the third artument in function gl.drawElements must be changed from gl.UNSIGNED_BYTE to short or int.
Step by Step Solution
3.42 Rating (158 Votes )
There are 3 Steps involved in it
Step12 To create the polygonal mesh surface for the given bivariate function you can follow the steps outlined in the question Partition the domain D0... View full answer

Get step-by-step solutions from verified subject matter experts