Answered step by step
Verified Expert Solution
Link Copied!

Question

1 Approved Answer

X 2 3 4 5 6 7 8 10 y 22 39 70 126 227 408 735 1322 2380 4285 a. Make a scatter plot

image text in transcribed
X 2 3 4 5 6 7 8 10 y 22 39 70 126 227 408 735 1322 2380 4285 a. Make a scatter plot of In y versus x. Use the scatter plot to find the equation for the line of best fit. b. Make a scatter plot of In y versus In x. Use the scatter plot to find the equation for the line of best fit. c. Based on your answers in part a and b, would an exponential model or a power model be better to represent this data? Explain. d. Use your answers from parts a and b to find an exponential model and a power model to represent this data by hand e. Use the regression feature on your calculator to find an exponential model and a power model to represent this data. f. Use your answer from parts c and d to make the best estimate for the number of hits your web site will have in 12 months ATTEMPT NOW

Step by Step Solution

There are 3 Steps involved in it

Step: 1

blur-text-image

Get Instant Access to Expert-Tailored Solutions

See step-by-step solutions with expert insights and AI powered tools for academic success

Step: 2

blur-text-image

Step: 3

blur-text-image

Ace Your Homework with AI

Get the answers you need in no time with our AI-driven, step-by-step assistance

Get Started

Recommended Textbook for

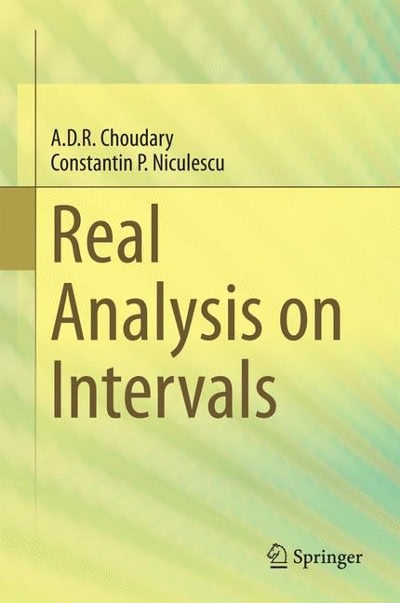
Real Analysis On Intervals

Authors: A D R Choudary, Constantin P Niculescu

1st Edition

8132221486, 9788132221487

More Books

Students also viewed these Mathematics questions

Question

Discuss how an AC is designed and implemented.

Answered: 1 week ago