Question
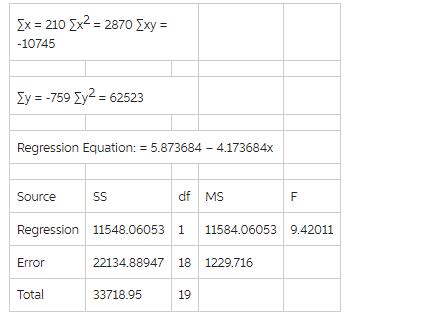
How many observations were used in the above regression? What percentage of the observed variability in Y is explained by X? What is the


How many observations were used in the above regression? What percentage of the observed variability in Y is explained by X? What is the correlation between X and Y? Give the value of the t statistic for testing whether the slope between X and Y is zero. What's the predicted value of Y when X is 8? Find the error margin for a 98% confidence interval for the average value of Y when X is 8 Ex = 210 Ex = 2870 [xy = -10745 y = -759 y2 = 62523 Regression Equation: = 5.873684- 4.173684x Source Error SS Regression 11548.06053 Total df MS 33718.95 11548.06053 1 11584.06053 9.42011 1 22134.88947 18 1229.716 F LL 19
Step by Step Solution
3.57 Rating (164 Votes )
There are 3 Steps involved in it
Step: 1
21 since degree of freedom is N1 So N1 19 N20 r n xy Ex y hence n2xEx ny ...
Get Instant Access to Expert-Tailored Solutions
See step-by-step solutions with expert insights and AI powered tools for academic success
Step: 2

Step: 3

Ace Your Homework with AI
Get the answers you need in no time with our AI-driven, step-by-step assistance
Get StartedRecommended Textbook for
A Pathway To Introductory Statistics
Authors: Jay Lehmann
1st Edition
0134107179, 978-0134107172
Students also viewed these Mathematics questions
Question
Answered: 1 week ago
Question
Answered: 1 week ago
Question
Answered: 1 week ago
Question
Answered: 1 week ago
Question
Answered: 1 week ago
Question
Answered: 1 week ago
Question
Answered: 1 week ago
Question
Answered: 1 week ago
Question
Answered: 1 week ago
Question
Answered: 1 week ago
Question
Answered: 1 week ago
Question
Answered: 1 week ago
Question
Answered: 1 week ago
Question
Answered: 1 week ago
Question
Answered: 1 week ago
Question
Answered: 1 week ago
Question
Answered: 1 week ago
Question
Answered: 1 week ago
Question
Answered: 1 week ago
Question
Answered: 1 week ago
Question
Answered: 1 week ago
View Answer in SolutionInn App


