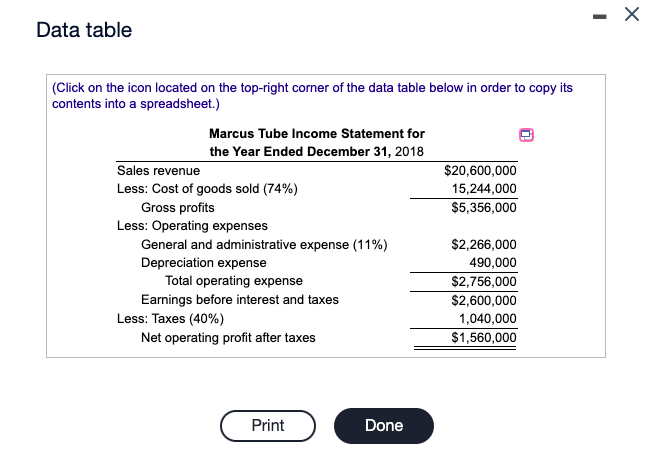
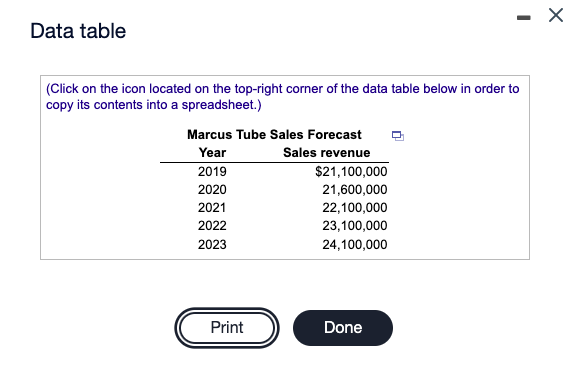
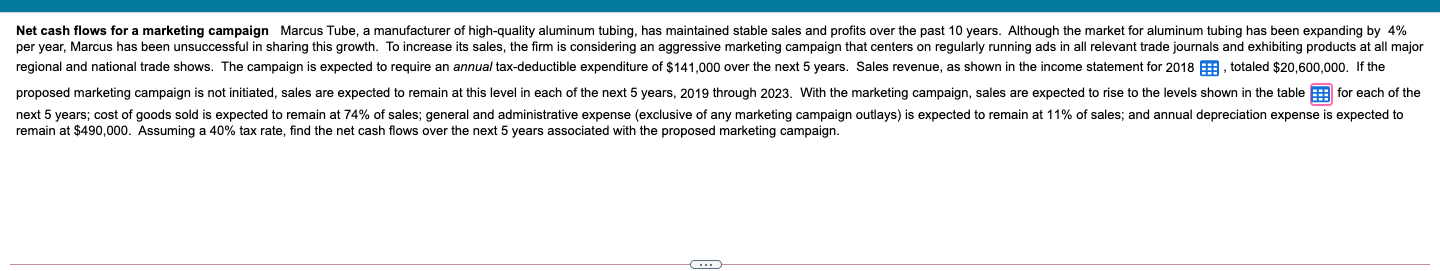
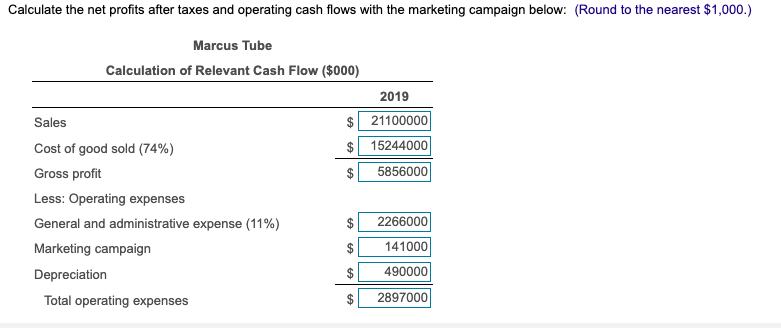
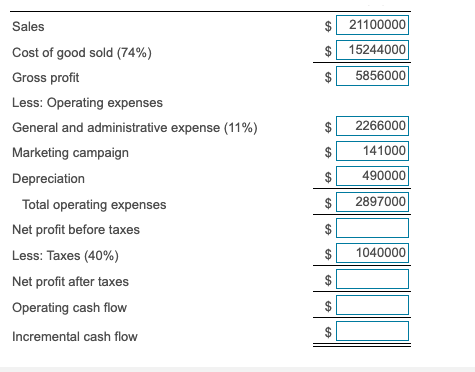
- X Data table 0 (Click on the icon located on the top-right corner of the data table below in order to copy its contents into a spreadsheet.) Marcus Tube Income Statement for the Year Ended December 31, 2018 Sales revenue $20,600,000 Less: Cost of goods sold (74%) 15,244,000 Gross profits $5,356,000 Less: Operating expenses General and administrative expense (11%) $2,266,000 Depreciation expense 490,000 Total operating expense $2,756,000 Earnings before interest and taxes $2,600,000 Less: Taxes (40%) 1,040,000 Net operating profit after taxes $1,560,000 Print Done Data table (Click on the icon located on the top-right corner of the data table below in order to copy its contents into a spreadsheet.) Marcus Tube Sales Forecast Year Sales revenue 2019 $21,100,000 2020 21,600,000 2021 22,100,000 2022 23,100,000 2023 24,100,000 Print Done Net cash flows for a marketing campaign Marcus Tube, a manufacturer of high-quality aluminum tubing, has maintained stable sales and profits over the past 10 years. Although the market for aluminum tubing has been expanding by 4% per year, Marcus has been unsuccessful in sharing this growth. To increase its sales, the firm is considering an aggressive marketing campaign that centers on regularly running ads in all relevant trade journals and exhibiting products at all major regional and national trade shows. The campaign is expected to require an annual tax-deductible expenditure of $141,000 over the next 5 years. Sales revenue, as shown in the income statement for 2018 , totaled $20,600,000. If the proposed marketing campaign is not initiated, sales are expected to remain at this level in each of the next 5 years, 2019 through 2023. With the marketing campaign, sales are expected to rise to the levels shown in the table for each of the next 5 years; cost of goods sold is expected to remain at 74% of sales, general and administrative expense (exclusive of any marketing campaign outlays) is expected to remain at 11% of sales; and annual depreciation expense is expected to remain at $490,000. Assuming a 40% tax rate, find the net cash flows over the next 5 years associated with the proposed marketing campaign. Calculate the net profits after taxes and operating cash flows with the marketing campaign below: (Round to the nearest $1,000.) Marcus Tube Calculation of Relevant Cash Flow ($000) 2019 Sales $ 21100000 Cost of good sold (74%) $ 15244000 Gross profit 5856000 Less: Operating expenses General and administrative expense (11%) 2266000 Marketing campaign 141000 Depreciation 490000 Total operating expenses 2897000 $ $ $ $ $ Sales $ $ $ 21100000 $ 15244000 5856000 $ 2266000 $ 141000 Cost of good sold (74%) Gross profit Less: Operating expenses General and administrative expense (11%) Marketing campaign Depreciation Total operating expenses Net profit before taxes Less: Taxes (40%) Net profit after taxes Operating cash flow $ 490000 $ 2897000 $ $ 1040000 $ $ Incremental cash flow $