Answered step by step
Verified Expert Solution
Question
1 Approved Answer
Xi Yi 20 2 60 4 46 3 41 2 12 1 137 10 68 5 89 5 4 1 32 2 144 9 156


Xi Yi 20 2 60 4 46 3 41 2 12 1 137 10 68 5 89 5 4 1 32 2 144 9 156 10 93 6 36 3 72 4 100 8 105 7 131 8 127 10 57 4 66 5 101 7 109 7 74 5 134 9 112 7 18 2 73 5 111 7 96 6 123 8 90 5 20 2 28 2 3 1 57 4 86 5 132 9 112 7 27 1 131 9 34 2 27 2 61 4 77 5 20 4 19 5 27 4 32 1 24 4 26 4 24 3 28 6 22 6 18 6 25 4 25 4 32 6 16 3 35 6 16 3 19 4 36 4 9 5 25 7 17 3 24 2 30 3 27 5 23 5 32 3 16 3 25 3 28 4 25 5 21 3 35 4 20 3 14 4 21 3 21 2 34 6 24 5 30 4 30 3 24 3 23 2 28 3 26 3 33 6
PLEASE CODE ALL THE ANSWERS OF 3.4 in R.
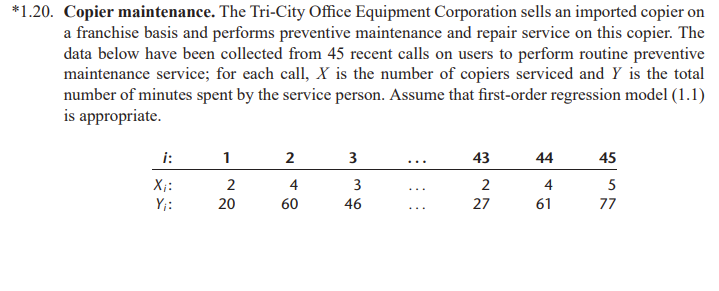
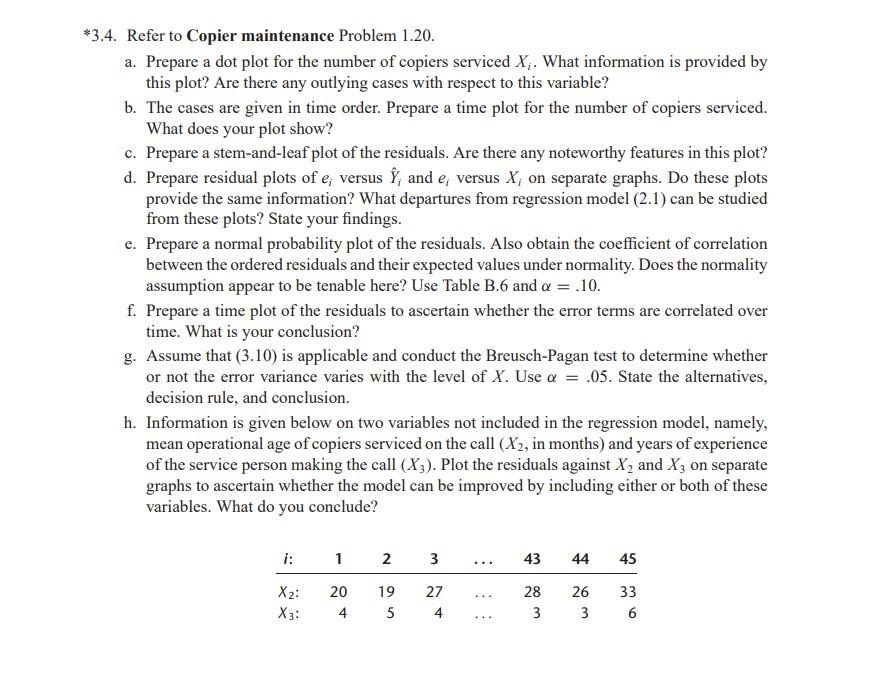
1.20. Copier maintenance. The Tri-City Office Equipment Corporation sells an imported copier on a franchise basis and performs preventive maintenance and repair service on this copier. The data below have been collected from 45 recent calls on users to perform routine preventive maintenance service; for each call, X is the number of copiers serviced and Y is the total number of minutes spent by the service person. Assume that first-order regression model (1.1) is appropriate. 3.4. Refer to Copier maintenance Problem 1.20. a. Prepare a dot plot for the number of copiers serviced Xi. What information is provided by this plot? Are there any outlying cases with respect to this variable? b. The cases are given in time order. Prepare a time plot for the number of copiers serviced. What does your plot show? c. Prepare a stem-and-leaf plot of the residuals. Are there any noteworthy features in this plot? d. Prepare residual plots of ei versus Y^i and ei versus Xi on separate graphs. Do these plots provide the same information? What departures from regression model (2.1) can be studied from these plots? State your findings. e. Prepare a normal probability plot of the residuals. Also obtain the coefficient of correlation between the ordered residuals and their expected values under normality. Does the normality assumption appear to be tenable here? Use Table B.6 and =.10. f. Prepare a time plot of the residuals to ascertain whether the error terms are correlated over time. What is your conclusion? g. Assume that (3.10) is applicable and conduct the Breusch-Pagan test to determine whether or not the error variance varies with the level of X. Use =.05. State the alternatives, decision rule, and conclusion. h. Information is given below on two variables not included in the regression model, namely, mean operational age of copiers serviced on the call ( X2, in months) and years of experience of the service person making the call (X3). Plot the residuals against X2 and X3 on separate graphs to ascertain whether the model can be improved by including either or both of these variables. What do you conclude? 1.20. Copier maintenance. The Tri-City Office Equipment Corporation sells an imported copier on a franchise basis and performs preventive maintenance and repair service on this copier. The data below have been collected from 45 recent calls on users to perform routine preventive maintenance service; for each call, X is the number of copiers serviced and Y is the total number of minutes spent by the service person. Assume that first-order regression model (1.1) is appropriate. 3.4. Refer to Copier maintenance Problem 1.20. a. Prepare a dot plot for the number of copiers serviced Xi. What information is provided by this plot? Are there any outlying cases with respect to this variable? b. The cases are given in time order. Prepare a time plot for the number of copiers serviced. What does your plot show? c. Prepare a stem-and-leaf plot of the residuals. Are there any noteworthy features in this plot? d. Prepare residual plots of ei versus Y^i and ei versus Xi on separate graphs. Do these plots provide the same information? What departures from regression model (2.1) can be studied from these plots? State your findings. e. Prepare a normal probability plot of the residuals. Also obtain the coefficient of correlation between the ordered residuals and their expected values under normality. Does the normality assumption appear to be tenable here? Use Table B.6 and =.10. f. Prepare a time plot of the residuals to ascertain whether the error terms are correlated over time. What is your conclusion? g. Assume that (3.10) is applicable and conduct the Breusch-Pagan test to determine whether or not the error variance varies with the level of X. Use =.05. State the alternatives, decision rule, and conclusion. h. Information is given below on two variables not included in the regression model, namely, mean operational age of copiers serviced on the call ( X2, in months) and years of experience of the service person making the call (X3). Plot the residuals against X2 and X3 on separate graphs to ascertain whether the model can be improved by including either or both of these variables. What do you concludeStep by Step Solution
There are 3 Steps involved in it
Step: 1

Get Instant Access to Expert-Tailored Solutions
See step-by-step solutions with expert insights and AI powered tools for academic success
Step: 2

Step: 3

Ace Your Homework with AI
Get the answers you need in no time with our AI-driven, step-by-step assistance
Get Started


