xxcgvb
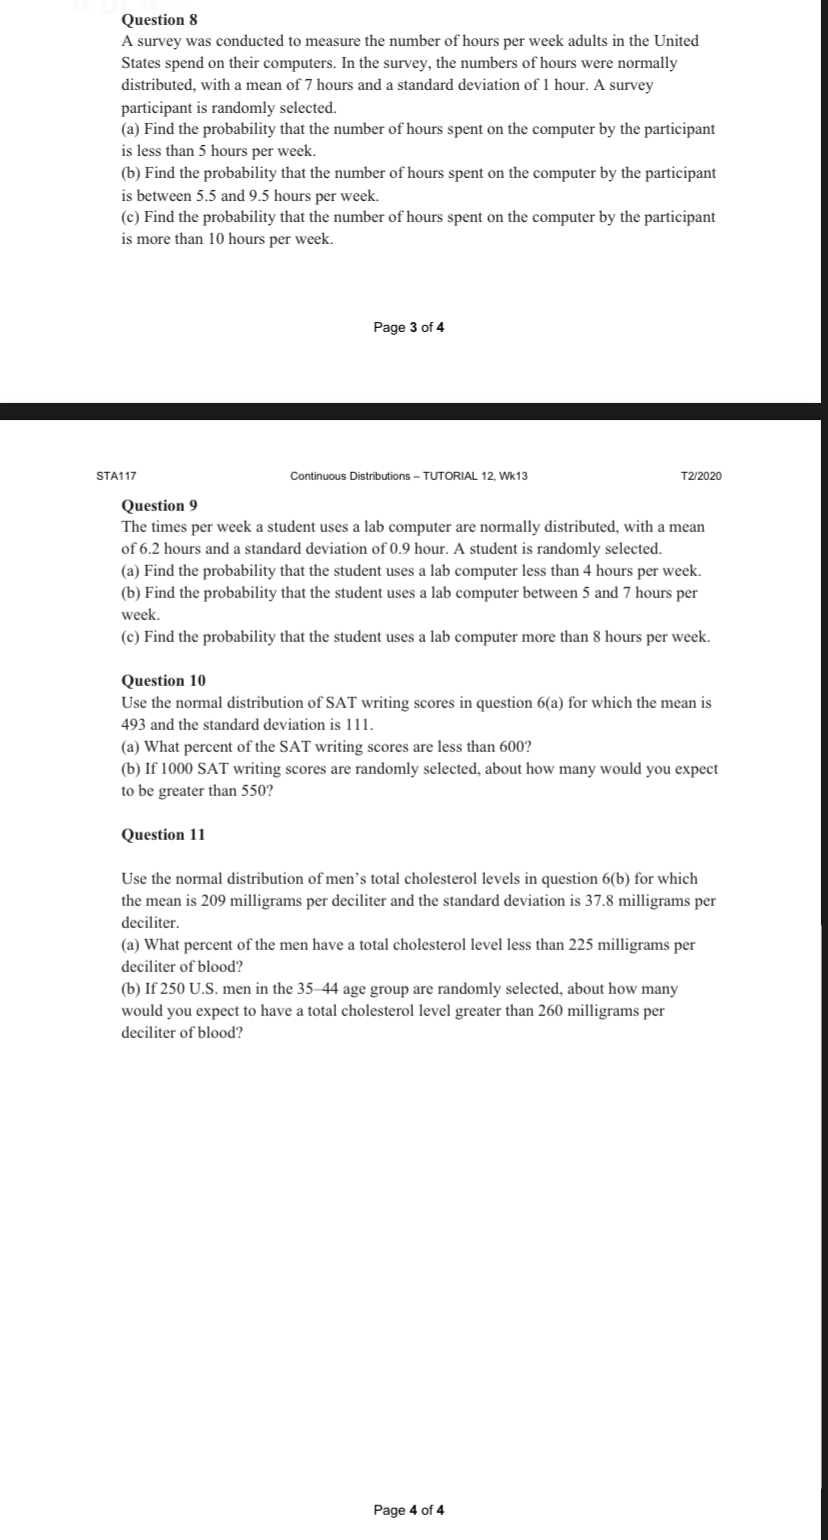
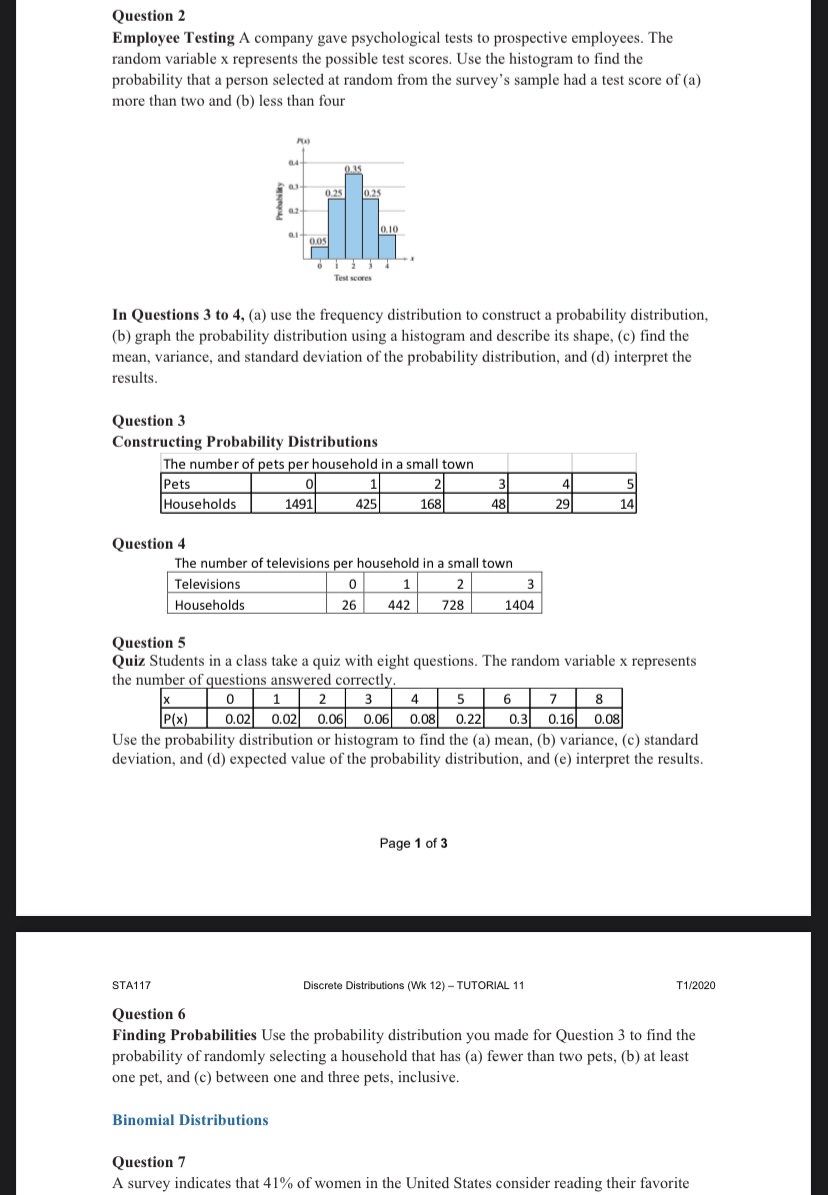
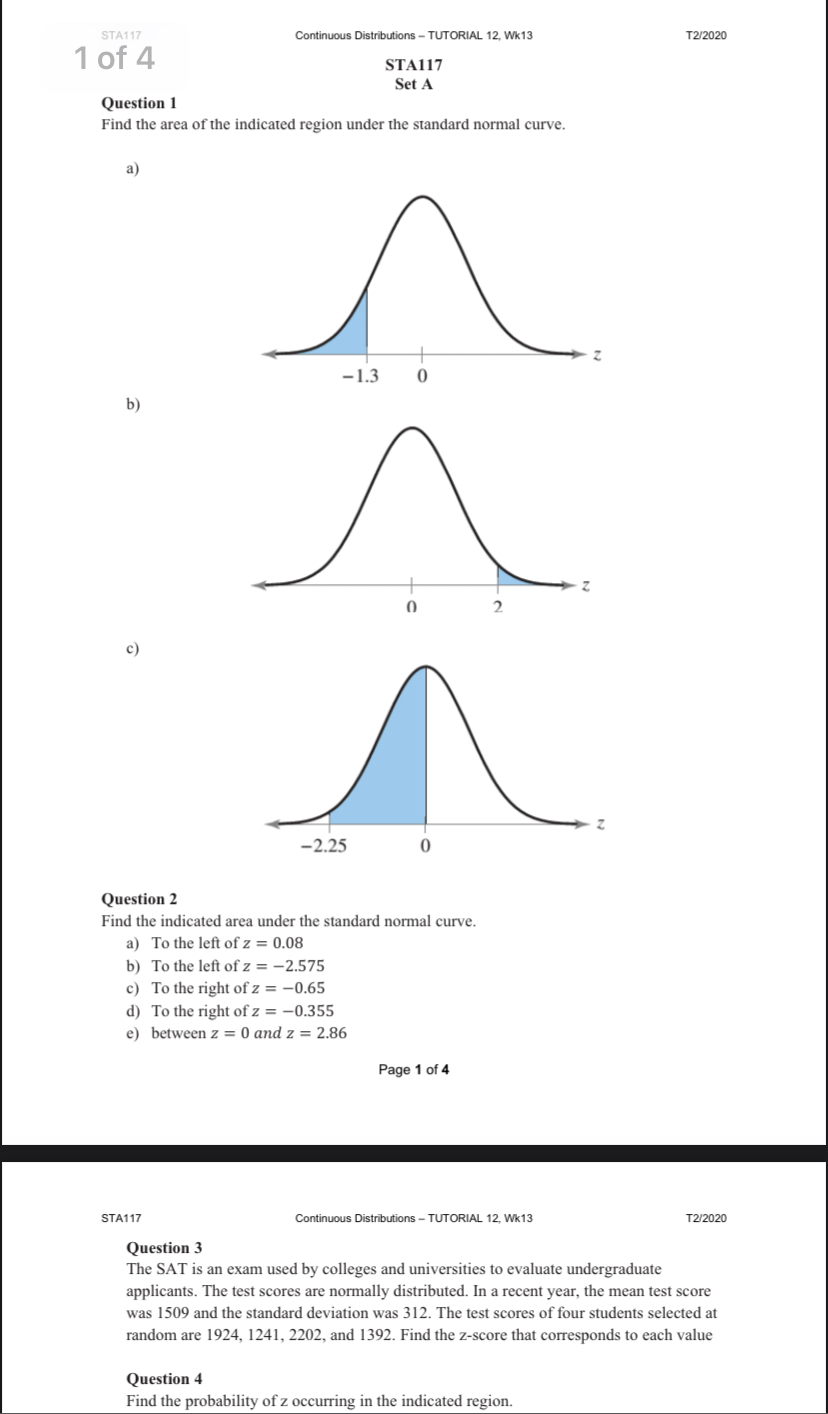
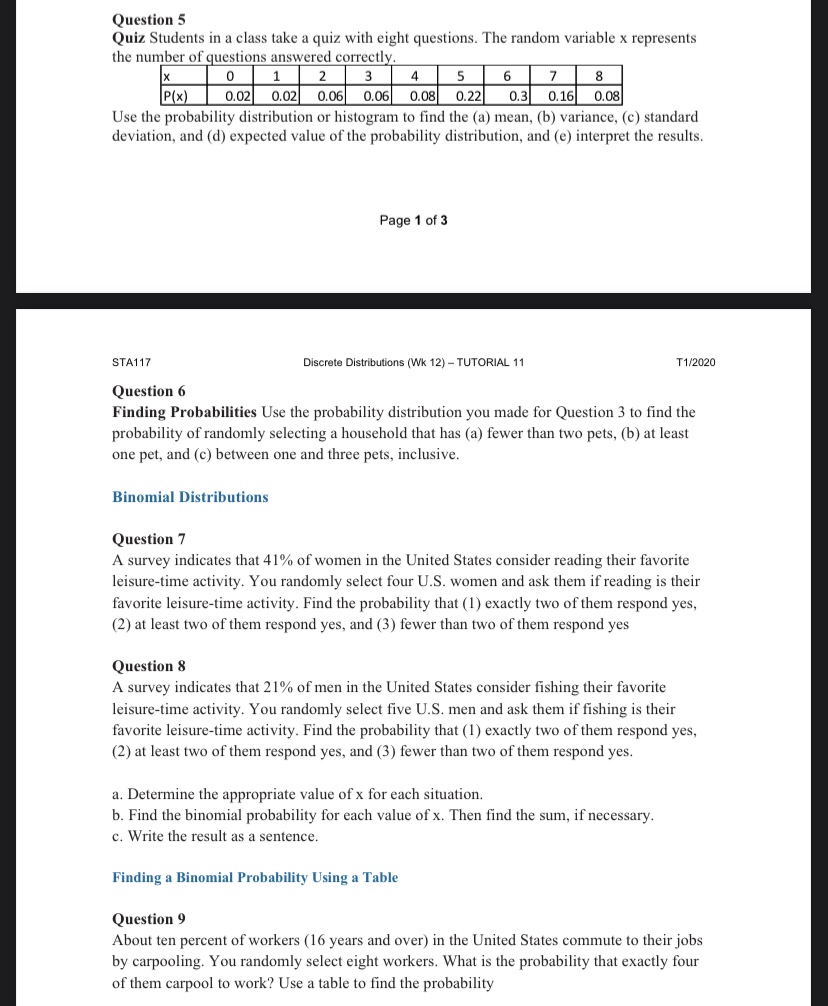
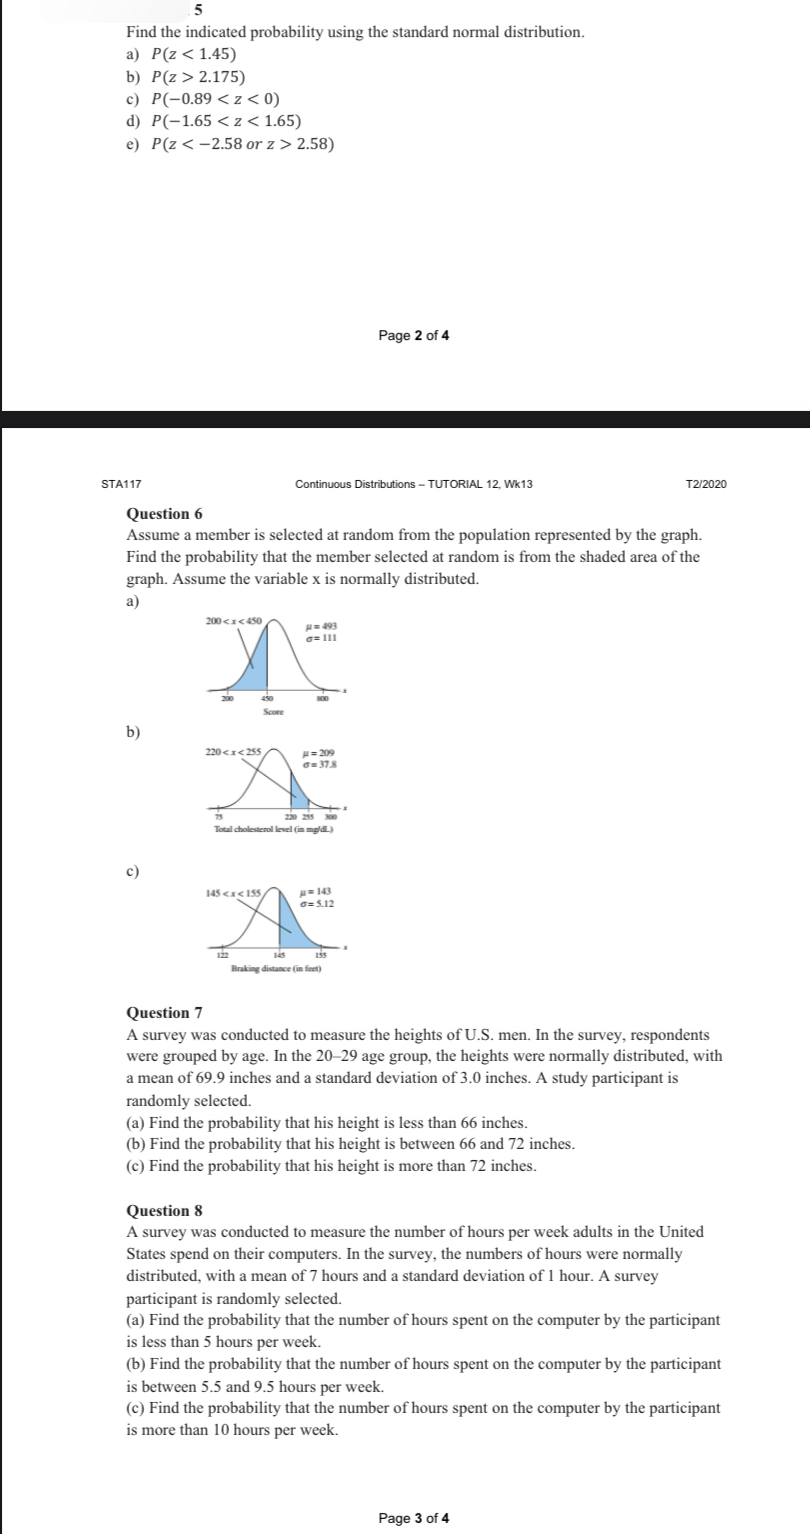
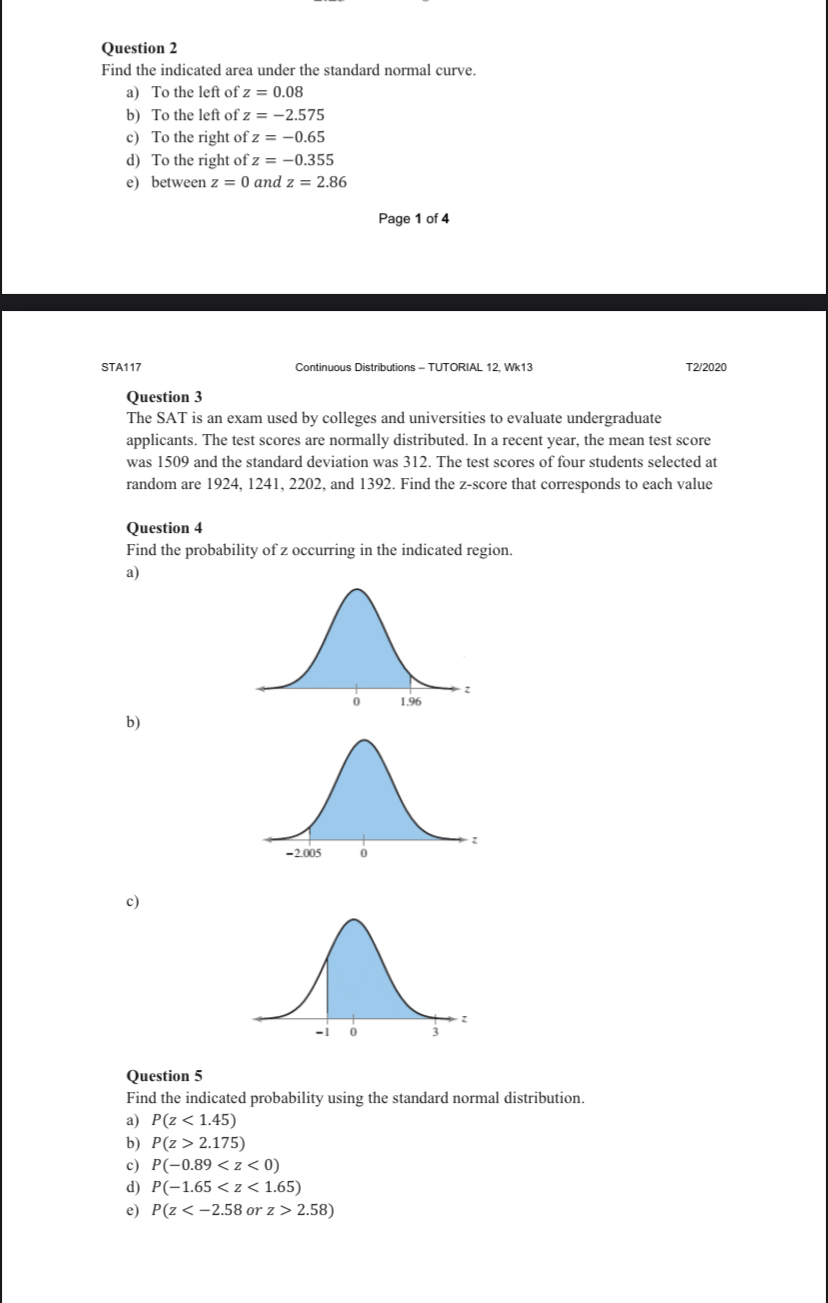
Question 8 A survey was conducted to measure the number of hours per week adults in the United States spend on their computers. In the survey. the numbers of hours were normally distributed, with a mean of 7 hours and a standard deviation of 1 hour. A survey participant is randomly selected. (a) Find the probability that the number of hours spent on the computer by the participant is less than 5 hours per week. (b) Find the probability that the number of hours spent on the computer by the participant is between 5.5 and 9.5 hours per week. (c) Find the probability that the number of hours spent on the computer by the participant is more than 10 hours per week. Pagesou STA\"? WNWm 11Wlt13 T2203) Question 9 The times per week a student uses a lab computer are nomtally distributed. with a mean of 6.2 hours and a standard deviation of 0.9 hour. A student is randomly selected. (a) Find the probability that the student uses a lab computer less than 4 hours per week. (b) Find the probability that the student uses a lab computer between 5 and 7' hours per week. (c) Find the probability that the student uses a lab computer more than 8 hours per week. Question 10 Use the normal distribution of SAT writing scores in question 6(a) for which the mean is 493 and the standard deviation is l I I. (a) What percent of the SAT writing scores are less than 600'? (b) [f 1000 SAT writing scores are randomly selected. about how many would you expect to be greater than 550'? Question 1] Use the normal distribution of men's total cholesterol levels in question 6(b) for which the mean is 209 milligram per deciliter and the standard deviation is 37.8 milligrams per deciliter. (a) What percent of the men have a total cholesterol level less than 225 milligrams per deciliter of blood? (b) [f 250 U.S. men in the 3544 age group are randome selected, about how many would you expect to have a total cholesterol level greater than 260 milligrams per deciliter of blood? Pagan\" Question 2 Employee Testing A company gave psychological tests to prospective employees. The random variable x represents the possible test scores. Use the histogram to find the probability that a person selected at random from the survey's sample had a test score of (a) more than two and (b) less than four 1 35 0.25 0.10 Test scores In Questions 3 to 4, (a) use the frequency distribution to construct a probability distribution, (b) graph the probability distribution using a histogram and describe its shape, (c) find the mean, variance, and standard deviation of the probability distribution, and (d) interpret the results. Question 3 Constructing Probability Distributions The number of pets per household in a small town Pets 1 2 Households 1491 425 168 W 48 29 14 Question 4 The number of televisions per household in a small town Televisions 0 1 2 3 Households 26 442 728 1404 Question 5 Quiz Students in a class take a quiz with eight questions. The random variable x represents the number of questions answered correctly 0 1 2 3 4 5 6 7 8 |P(x) 0.02 0.02 0.06 0.06 0.08 0.22 0.3 0.16 0.08 Use the probability distribution or histogram to find the (a) mean, (b) variance, (c) standard deviation, and (d) expected value of the probability distribution, and (e) interpret the results. Page 1 of 3 STA117 Discrete Distributions (Wk 12) - TUTORIAL 11 T1/2020 Question 6 Finding Probabilities Use the probability distribution you made for Question 3 to find the probability of randomly selecting a household that has (a) fewer than two pets, (b) at least one pet, and (c) between one and three pets, inclusive. Binomial Distributions Question 7 A survey indicates that 41% of women in the United States consider reading their favoriteSTA117 Continuous Distributions - TUTORIAL 12, Wk13 T2/2020 1 of 4 STA117 Set A Question 1 Find the area of the indicated region under the standard normal curve. a) -1.3 0 b) 0 2. c) -2.25 0 Question 2 Find the indicated area under the standard normal curve. a) To the left of z = 0.08 b) To the left of z = -2.575 c) To the right of z = -0.65 d) To the right of z = -0.355 e) between z = 0 and z = 2.86 Page 1 of 4 STA117 Continuous Distributions - TUTORIAL 12, Wk13 T2/2020 Question 3 The SAT is an exam used by colleges and universities to evaluate undergraduate applicants. The test scores are normally distributed. In a recent year, the mean test score was 1509 and the standard deviation was 312. The test scores of four students selected at random are 1924, 1241, 2202, and 1392. Find the z-score that corresponds to each value Question 4 Find the probability of z occurring in the indicated region.Question 5 Quiz Students in a class take a quiz with eight questions. The random variable x represents the number of questions answered correctly 0 1 2 3 4 5 6 7 8 P(x) 0.02 0.02 0.06 0.06 0.08 0.22 0.3 0.16 0.08 Use the probability distribution or histogram to find the (a) mean, (b) variance, (c) standard deviation, and (d) expected value of the probability distribution, and (e) interpret the results. Page 1 of 3 STA117 Discrete Distributions (Wk 12) - TUTORIAL 11 T1/2020 Question 6 Finding Probabilities Use the probability distribution you made for Question 3 to find the probability of randomly selecting a household that has (a) fewer than two pets, (b) at least one pet, and (c) between one and three pets, inclusive. Binomial Distributions Question 7 A survey indicates that 41% of women in the United States consider reading their favorite leisure-time activity. You randomly select four U.S. women and ask them if reading is their favorite leisure-time activity. Find the probability that (1) exactly two of them respond yes, (2) at least two of them respond yes, and (3) fewer than two of them respond yes Question 8 A survey indicates that 21% of men in the United States consider fishing their favorite leisure-time activity. You randomly select five U.S. men and ask them if fishing is their favorite leisure-time activity. Find the probability that (1) exactly two of them respond yes, (2) at least two of them respond yes, and (3) fewer than two of them respond yes. a. Determine the appropriate value of x for each situation. b. Find the binomial probability for each value of x. Then find the sum, if necessary. c. Write the result as a sentence. Finding a Binomial Probability Using a Table Question 9 About ten percent of workers (16 years and over) in the United States commute to their jobs by carpooling. You randomly select eight workers. What is the probability that exactly four of them carpool to work? Use a table to find the probability5 Find the indicated probability using the standard nom'ial distribution. a} P(z 4: 1.45) h} P(z > 2.1?5) c} P(t].89 t: z s: 0) d] P(1.65 c: z c: 1.65) e) P(z 4: 2.58 or z > 2.53) PageZof4 STAN? OoriimousDialrhliorB TUT[RIAL 12. M13 T2202) Question 6 Assume a member is selected at random from the population represented by the graph. Find the probability that the member selected at random is from the shaded area of the graph. Assume the variable x is normally distributed a) \"14m - I; - b) C) m c: a 2.175) c) P(-0.89 2.58)
