Yalan Dunya 35. Bolum - YouTu x MindTap - Cengage Learning X Homework Help - Q&A from Or x G Elissa Epel, a professor of
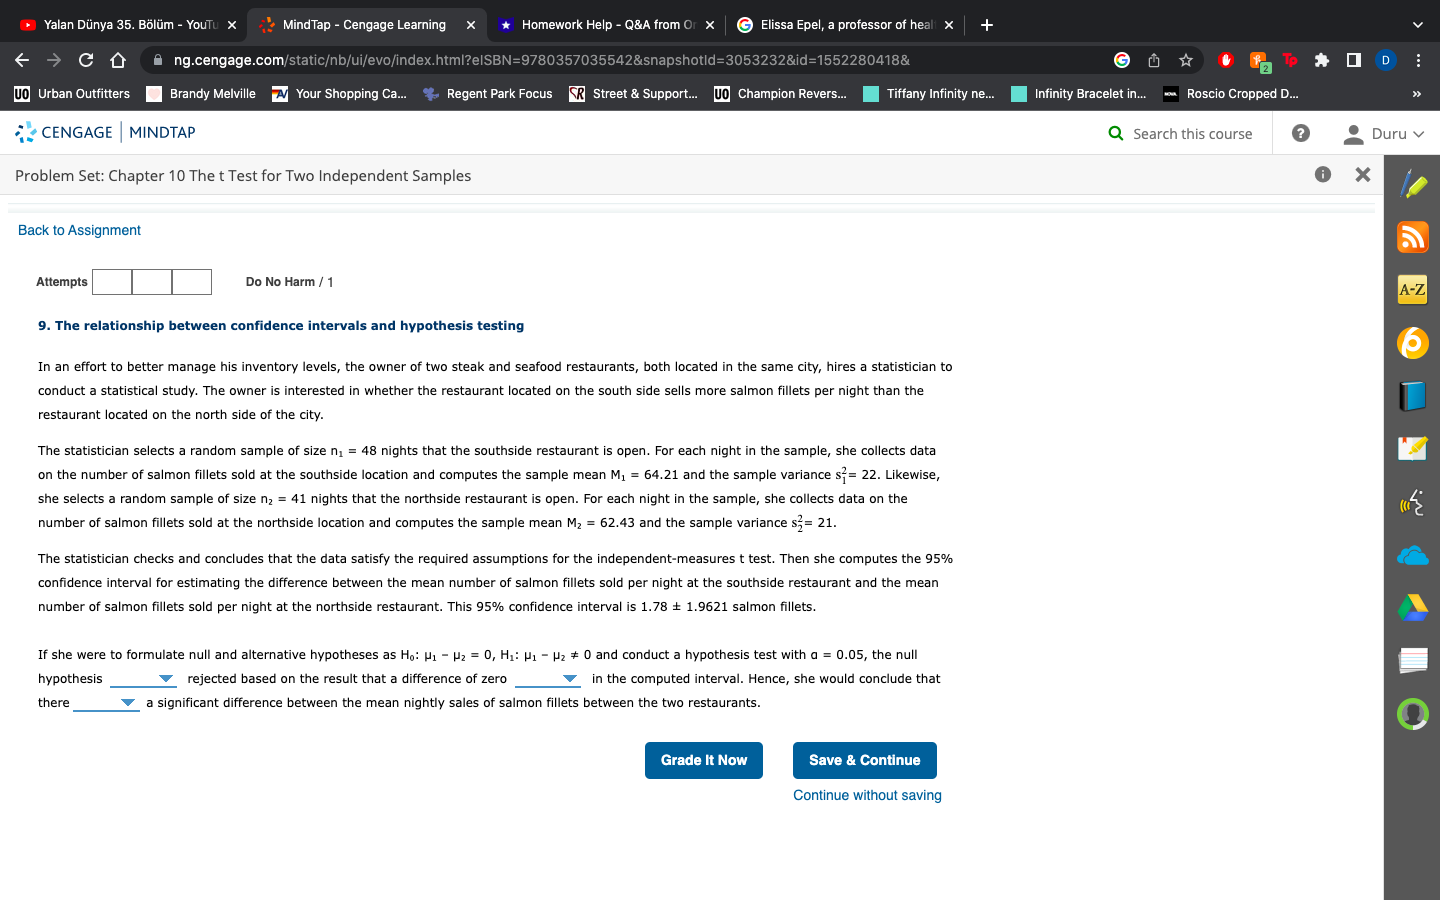
Yalan Dunya 35. Bolum - YouTu x MindTap - Cengage Learning X Homework Help - Q&A from Or x G Elissa Epel, a professor of heal x C D ng.cengage.com/staticb/ui/evo/index.html?eISBN=9780357035542&snapshotld=3053232&id=1552280418& G TP # I D Uo Urban Outfitters Brandy Melville A Your Shopping Ca. Regent Park Focus R Street & Support. UO Champion Revers. Tiffany Infinity ne. Infinity Bracelet in. Roscio Cropped D.. CENGAGE | MINDTAP Q Search this course Duru v Problem Set: Chapter 10 The t Test for Two Independent Samples X Back to Assignment Attempts Do No Harm / 1 A-Z 9. The relationship between confidence intervals and hypothesis testing In an effort to better manage his inventory levels, the owner of two steak and seafood restaurants, both located in the same city, hires a statistician to conduct a statistical study. The owner is interested in whether the restaurant located on the south side sells more salmon fillets per night than the restaurant located on the north side of the city. The statistician selects a random sample of size n, = 48 nights that the southside restaurant is open. For each night in the sample, she collects data on the number of salmon fillets sold at the southside location and computes the sample mean M, = 64.21 and the sample variance s; = 22. Likewise, she selects a random sample of size n = 41 nights that the northside restaurant is open. For each night in the sample, she collects data on the number of salmon fillets sold at the northside location and computes the sample mean My = 62.43 and the sample variance s; = 21. The statistician checks and concludes that the data satisfy the required assumptions for the independent-measures t test. Then she computes the 95% confidence interval for estimating the difference between the mean number of salmon fillets sold per night at the southside restaurant and the mean number of salmon fillets sold per night at the northside restaurant. This 95% confidence interval is 1.78 + 1.9621 salmon fillets. If she were to formulate null and alternative hypotheses as Ho: 1 - 2 = 0, H1: Hi - H2 # 0 and conduct a hypothesis test with a = 0.05, the null hypothesis rejected based on the result that a difference of zero in the computed interval. Hence, she would conclude that there a significant difference between the mean nightly sales of salmon fillets between the two restaurants. Grade It Now Save & Continue Continue without
Step by Step Solution
There are 3 Steps involved in it
Step: 1
Get Instant Access to Expert-Tailored Solutions
See step-by-step solutions with expert insights and AI powered tools for academic success
Step: 2
Step: 3
Ace Your Homework with AI
Get the answers you need in no time with our AI-driven, step-by-step assistance