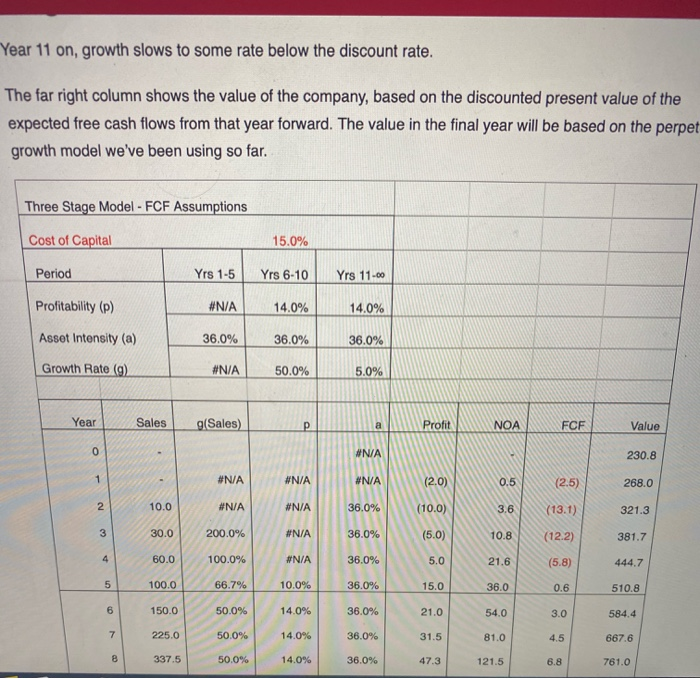
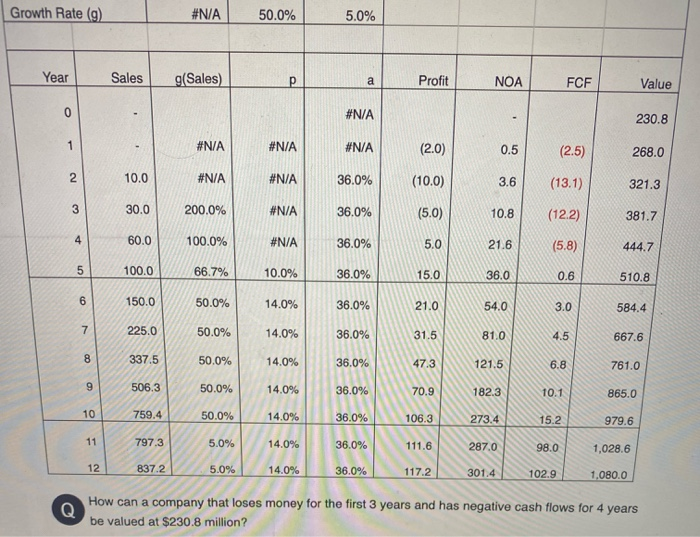
Year 11 on, growth slows to some rate below the discount rate. The far right column shows the value of the company, based on the discounted present value of the expected free cash flows from that year forward. The value in the final year will be based on the perpet growth model we've been using so far. Three Stage Model - FCF Assumptions Cost of Capital 15.0% Period Yrs 1-5 Yrs 6-10 Yrs 11.00 Profitability (p) #N/A 14.0% 14.0% Asset Intensity (a) 36.0% 36.0% 36.0% Growth Rate (9) #N/A 50.0% 5.0% Year Sales g(Sales) a Profit Profit NOA FCF Value 0 #N/A 230.8 1 #N/A #N/A #N/A (2.0) 0.5 (2.5) 268.0 N 10.0 #N/A #N/A 36.0% (10.0) 3.6 (13.1) 321.3 3 30.0 200.0% #N/A 36.0% (5.0) 10.8 (12.2) 381.7 4 60.0 100.0% #N/A 36.0% 5.0 21.6 (5.8) 444.7 5 100.0 66.7% 10.0% 36.0% 15.0 36.0 0.6 510.8 ON 150.0 50.0% 14.0% 36.0% 21.0 54.0 3.0 584.4 7 225.0 50.0% 14.0% 36.0% 31.5 81.0 4.5 667.6 8 337.5 50.0% 14.0% 36.0% 47.3 121.5 6.8 761.0 Growth Rate (9) #N/A 50.0% 5.0% Year Sales g(Sales) a Profit NOA FCF Value 0 #N/A 230.8 1 #N/A #N/A #N/A (2.0) 0.5 (2.5) 268.0 10.0 #N/A #N/A 36.0% (10.0) 3.6 (13.1) 321.3 2. 3 30.0 200.0% #N/A 36.0% (5.0) 10.8 (12.2) 381.7 4 60.0 100.0% #N/A 36.0% 5.0 21.6 (5.8) 444.7 100.0 66.7% 10.0% 36.0% 15.0 36.0 0.6 510.8 5 6 150.0 50.0% 14.0% 36.0% 21.0 54.0 3.0 584.4 7 225.0 50.0% 14.0% 36.0% 31.5 81.0 4.5 667.6 8 337.5 50.0% 14.0% 36.0% 47.3 121.5 6.8 761.0 9 506.3 50.0% 14.0% 36.0% 70.9 182.3 10.1 865.0 10 759.4 50.0% 14.0% 36.0% 106.3 273.4 15.2 979.6 11 797.3 5.0% 14.0% 36.0% 111.6 287.0 98.0 1,028.6 12 837.2 5.0% 14.0% 36.0% 117.2 301.4 102.9 1,080.0 Q How can a company that loses money for the first 3 years and has negative cash flows for 4 years be valued at $230.8 million