Answered step by step
Verified Expert Solution
Question
1 Approved Answer
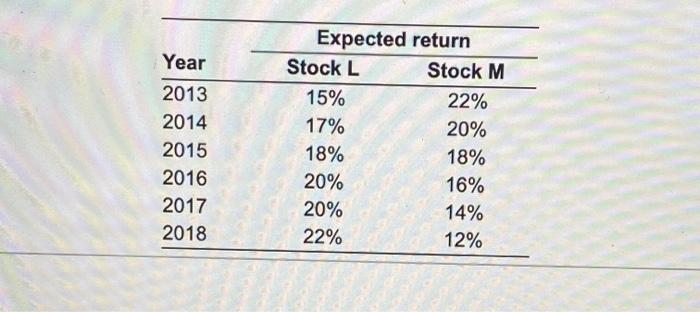
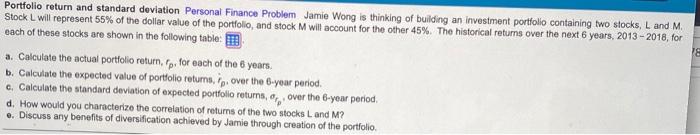
Year 2013 2014 2015 2016 2017 2018 Expected return Stock L Stock M 15% 22% 17% 20% 18% 20% 16% 20% 14% 22% 12% 18%
Step by Step Solution
There are 3 Steps involved in it
Step: 1

Get Instant Access to Expert-Tailored Solutions
See step-by-step solutions with expert insights and AI powered tools for academic success
Step: 2

Step: 3
Ace Your Homework with AI
Get the answers you need in no time with our AI-driven, step-by-step assistance
Get Started