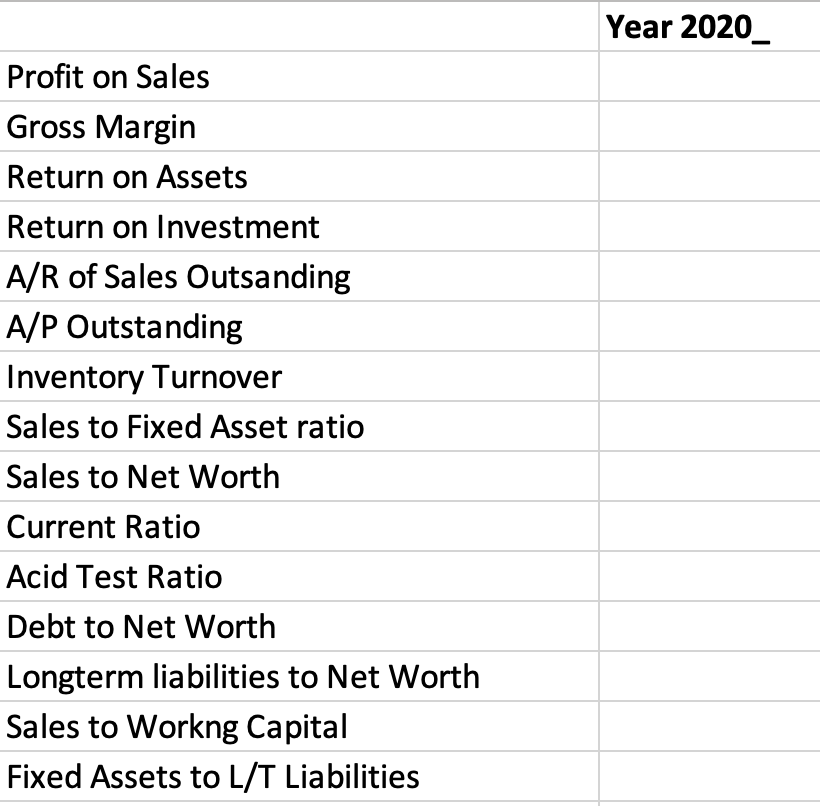
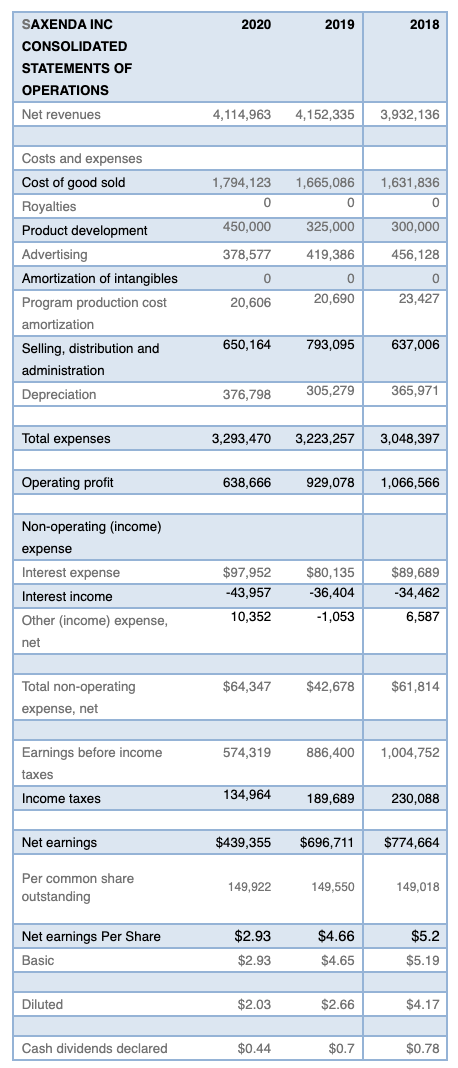
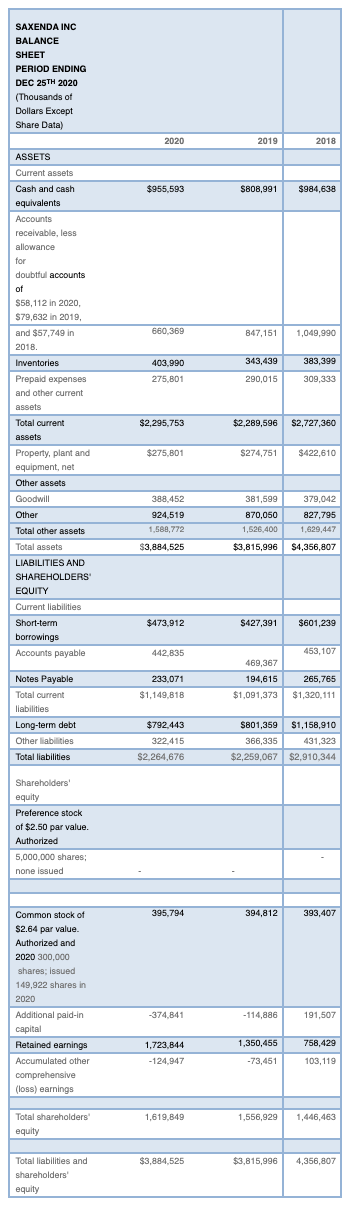
Year 2020 Profit on Sales Gross Margin Return on Assets Return on Investment A/R of Sales Outsanding A/P Outstanding Inventory Turnover Sales to Fixed Asset ratio Sales to Net Worth Current Ratio Acid Test Ratio Debt to Net Worth Longterm liabilities to Net Worth Sales to Workng Capital Fixed Assets to L/T Liabilities 2020 2019 2018 SAXENDA INC CONSOLIDATED STATEMENTS OF OPERATIONS Net revenues 4,114,963 4,152,335 3,932, 136 Costs and expenses 1,794,123 0 1,665,086 0 1,631,836 0 450,000 325,000 300,000 378,577 419,386 456,128 0 0 Cost of good sold Royalties Product development Advertising Amortization of intangibles Program production cost amortization Selling, distribution and administration Depreciation 0 20,690 20,606 23,427 650,164 793,095 637,006 376,798 305,279 365,971 Total expenses 3,293,470 3,223,257 3,048,397 Operating profit 638,666 929,078 1,066,566 Non-operating (income) expense Interest expense Interest income Other (income) expense, net $97,952 -43,957 $80,135 -36,404 -1,053 $89,689 -34,462 6,587 10,352 Total non-operating $64,347 $42,678 $61,814 expense, net 574,319 886,400 1,004,752 Earnings before income taxes Income taxes 134,964 189,689 230,088 Net earnings $439,355 $696,711 $774,664 Per common share outstanding 149,922 149,550 149,018 $2.93 Net earnings Per Share Basic $4.66 $4.65 $5.2 $5.19 $2.93 Diluted $2.03 $2.66 $4.17 Cash dividends declared $0.44 $0.7 $0.78 SAXENDA INC BALANCE SHEET PERIOD ENDING DEC 25TH 2020 (Thousands of Dollars Except Share Data) 2020 2019 2018 $955,593 $808,991 $984,638 660,369 847,151 1.049,990 403.990 343,439 383,399 275.801 290,015 309,333 ASSETS Current assets Cash and cash equivalents Accounts receivable, less allowance for doubtful accounts of $58,112 in 2020, $79,632 in 2019, and $57,749 in 2018. Inventories Prepaid expenses and other current assets Total current assets Property, plant and equipment, net Other assets Goodwill Other Total other assets osatorer local Total assets LIABILITIES AND SHAREHOLDERS EQUITY Current liabilities Short-term borrowings Accounts payable $2,295,753 $2,289,596 $2,727,360 $275,801 $274,751 $422,610 388,452 924,519 1,588,772 381,599 870,050 1,526.400 379,042 827,795 1,629,447 $3,884,525 $3,815,996 $4,356,807 $473,912 $427,391 $601,239 442,835 453,107 469,367 233,071 $1,149,818 194,615 $1,091,373 265,765 $1,320, 111 Notes Payable Total current liabilities Long-term debt Other liabilities Total liabilities $792,443 322.415 $2,264,676 $801,359 $1,158,910 366,335 431,323 $2,259,067 $2,910,344 Shareholders equity Preference stock of $2.50 par value. Authorized 5.000.000 shares none issued 395,794 394,812 393,407 Common stock of $2.64 par value. Authorized and 2020 300,000 shares: issued 149,922 shares in 2020 Additional paid in capital Retained earnings Accumulated other comprehensive (loss) earnings -374,841 - 114,886 191,507 1,350,455 758,429 1,723.844 -124,947 -73,451 103,119 1,619,849 1,556,929 1,446,463 Total shareholders equity $3,884,525 $3,815,996 4,356,807 Total liabilities and shareholders equity