

Answered step by step
Verified Expert Solution
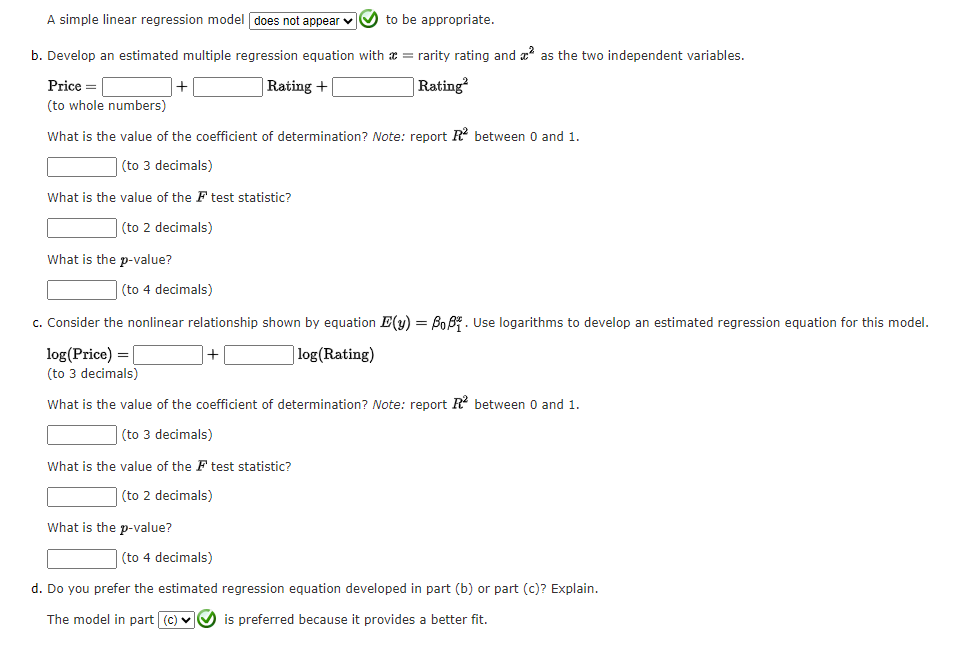
Question
1 Approved Answer
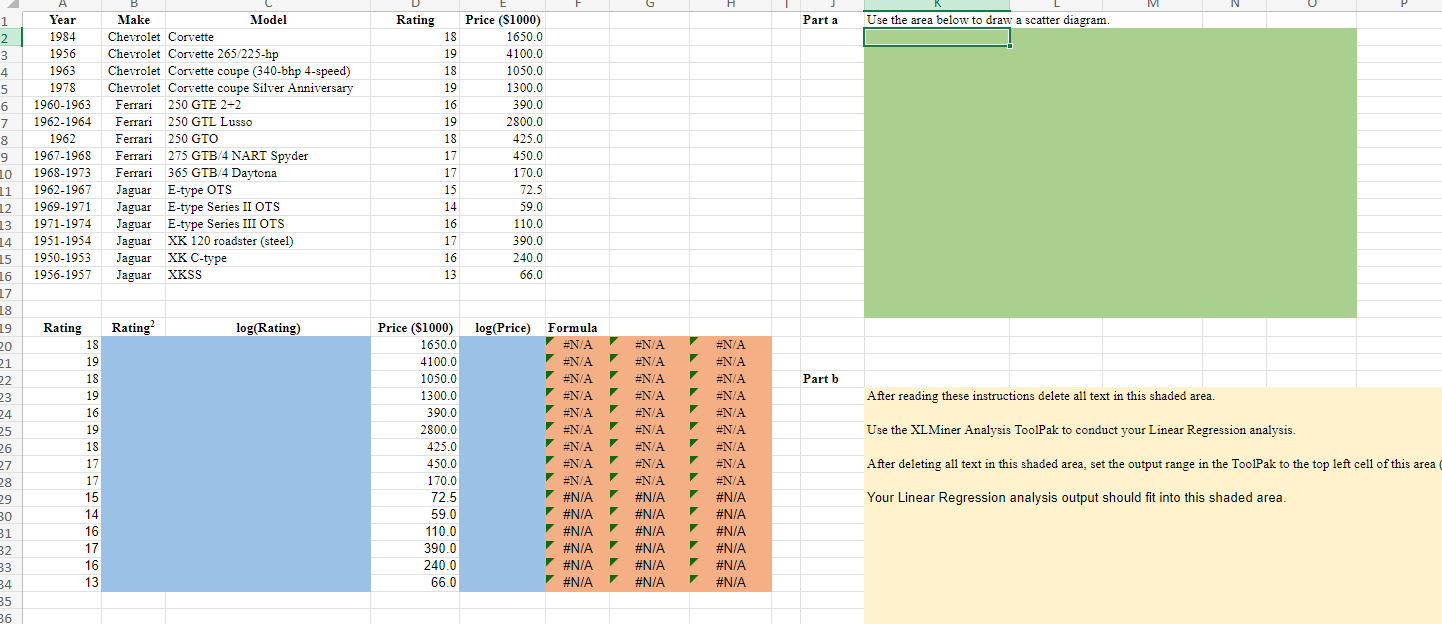
Year Make Model Rating Price ($1000) Part a Use the area below to draw a scatter diagram. 1984 Chevrolet Corvette 18 1650.0 1956 Chevrolet Corvette
Step by Step Solution
There are 3 Steps involved in it
Step: 1

Get Instant Access to Expert-Tailored Solutions
See step-by-step solutions with expert insights and AI powered tools for academic success
Step: 2

Step: 3
Ace Your Homework with AI
Get the answers you need in no time with our AI-driven, step-by-step assistance
Get Started
Business Analytics Data Analysis and Decision Making
Authors: S. Christian Albright, Wayne L. Winston
5th edition
1133629601, 9781285965529 , 978-1133629603