Question
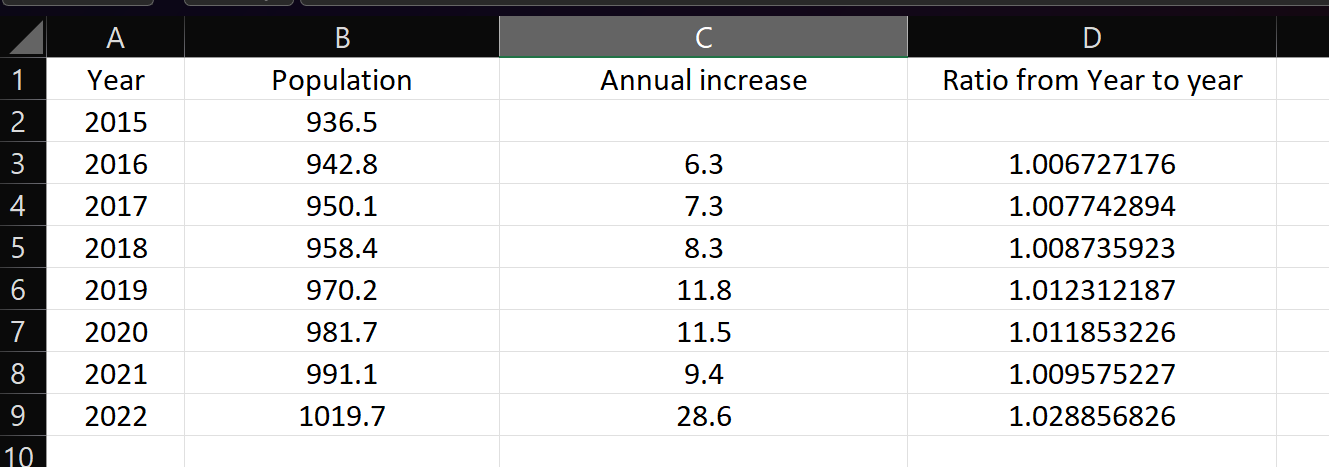
Year Population 2015 936.5 2016 942.8 2017 950.1 2018 958.4 2019 970.2 2020 981.7 2021 991.1 2022 1019.7 (a) Draw a well-labeled graph showing the
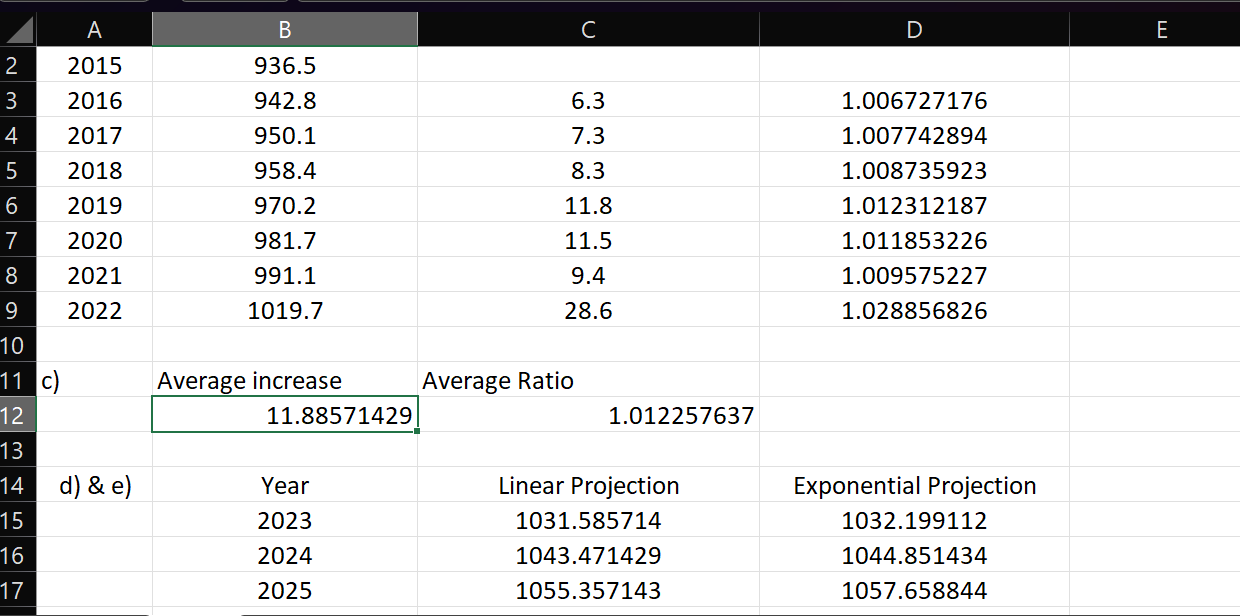
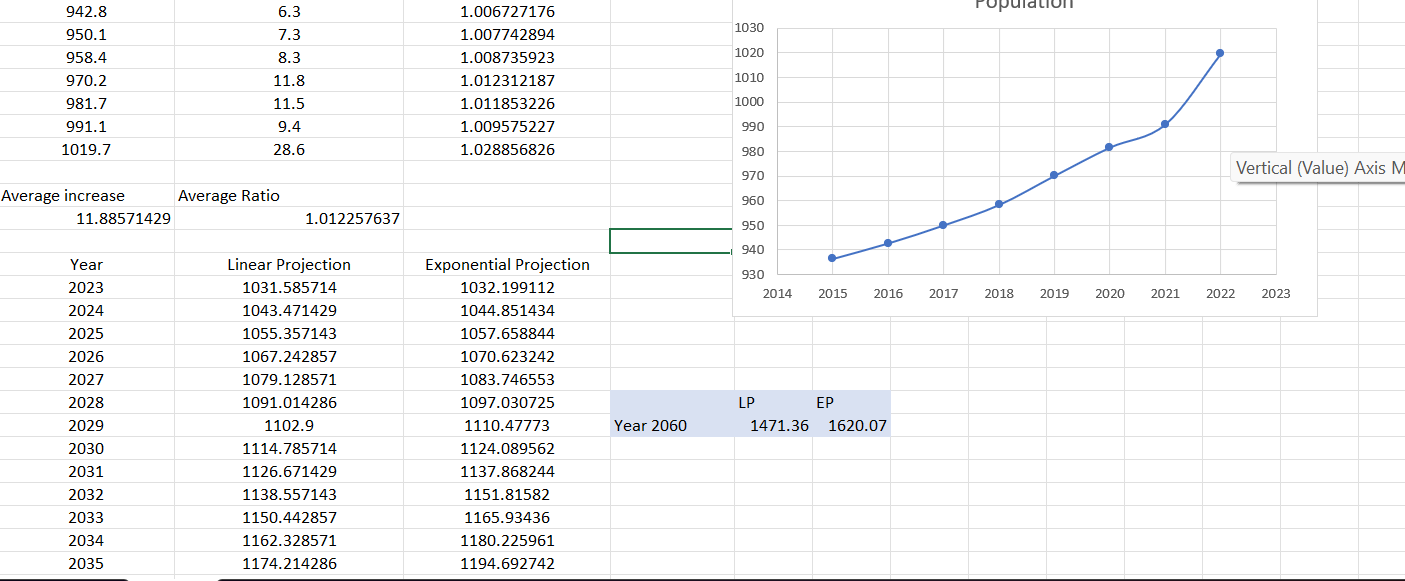
Year Population 2015 936.5 2016 942.8 2017 950.1 2018 958.4 2019 970.2 2020 981.7 2021 991.1 2022 1019.7 (a) Draw a well-labeled graph showing the population. (b) Add two more columns to your table, one showing the increases from year to year, and one showing the ratio from year to year. (c) Find the average increase and the average ratio to develop both linear and expo- nential formulas to represent the population. (d) Use the two formulas to generate the population for 2060 and compare it to the government's projection of two million. (e) Use the two formulas to plot a graph showing the two projections for the next 60 years. (f) Which model is more realistic for the long term population of Nova Scotia? On excel


 \f\f942.8 6.3 1.006727176 950.1 7.3 1.007742894 1030 958.4 8.3 1.008735923 1020 970.2 11.8 1.012312187 1010 981.7 11.5 1.011853226 1000 991.1 9.4 1.009575227 990 1019.7 28.6 1.028856826 980 970 Vertical (Value) Axis M Average increase Average Ratio 960 11.88571429 1.012257637 950 940 Year Linear Projection Exponential Projection 930 2023 1031.585714 1032.199112 2014 2015 2016 2017 2018 2019 2020 2021 2022 2023 2024 1043.471429 1044.851434 2025 1055.357143 1057.658844 2026 1067.242857 1070.623242 2027 1079.128571 1083.746553 2028 1091.014286 1097.030725 LP EP 2029 1102.9 1110.47773 Year 2060 1471.36 1620.07 2030 1114.785714 1124.089562 2031 1126.671429 1137.868244 2032 1138.557143 1151.81582 2033 1150.442857 1165.93436 2034 1162.328571 1180.225961 2035 1174.214286 1194.6927421721.821336 Population Projection 1742.926797 2500 1764.290961 1785.916999 1807.808122 1829.967577 1852.398656 2000 1875.104686 1898.089039 1921.355125 1944.906399 1500 bo..........oo. 1968.746355 1992.878534 2017.306515 2042.033926 1000 2067.064437 2092.401762 2118.049664 2144.011947 500 2170.292468 2196.895125 2223.823868 Plot Area 2251.082694 2278.675648 2010 2020 2030 2040 2050 2060 2070 2080 2090 2100 -Linear Projection Exponential Projection
 Step by Step Solution
There are 3 Steps involved in it
Step: 1

Get Instant Access to Expert-Tailored Solutions
See step-by-step solutions with expert insights and AI powered tools for academic success
Step: 2

Step: 3

Ace Your Homework with AI
Get the answers you need in no time with our AI-driven, step-by-step assistance
Get Started


