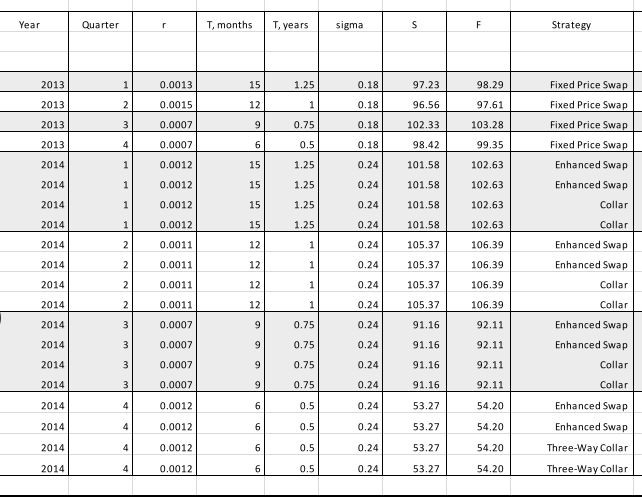

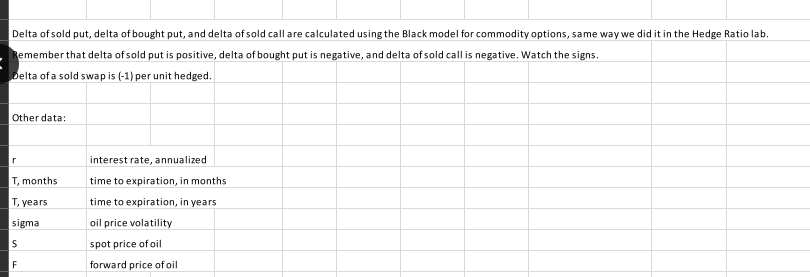
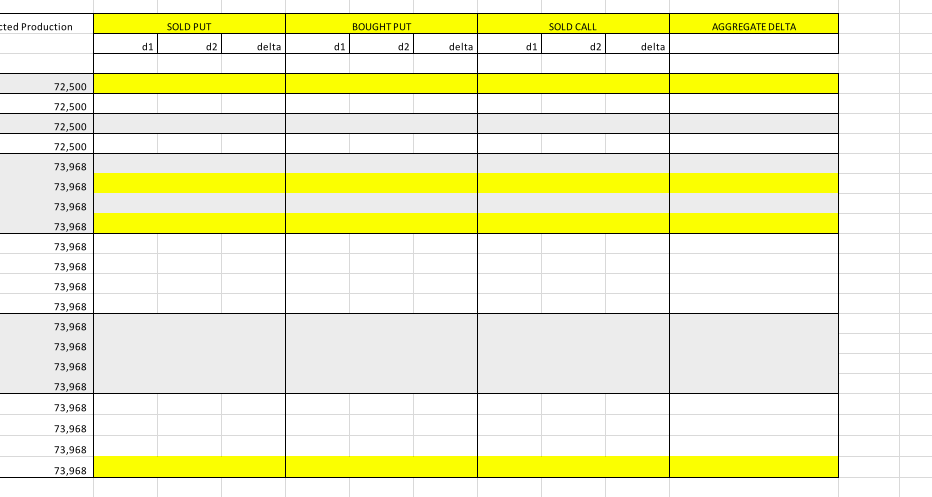
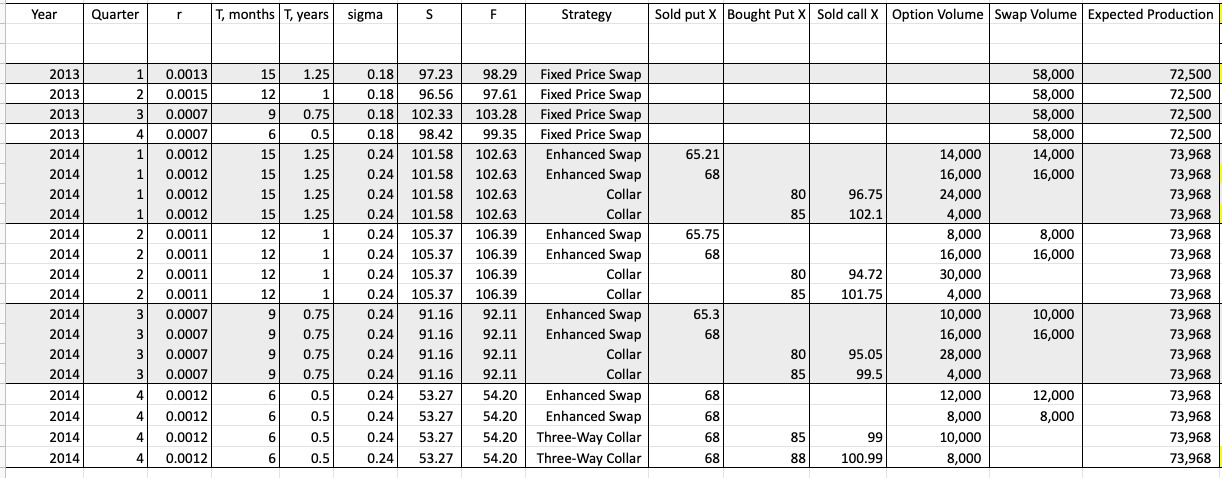
Year Quarter r T, months T, years sigma S F Strategy 2013 1 0.0013 15 1.25 0.18 97.23 Fixed Price Swap 98.29 97.61 0.0015 12 1 0.18 96.56 2013 2013 2 3 0.0007 9 0.75 0.18 102.33 103.28 2013 4 0.0007 6 0.5 0.18 98.42 99.35 ND Fixed Price Swap Fixed Price Swap Fixed Price Swap Enhanced Swap Enhanced Swap Collar 2014 1 0.0012 15 1.25 0.24 101.58 102.63 2014 1 0.0012 15 1.25 0.24 101.58 102.63 2014 1 0.0012 15 1.25 0.24 101.58 102.63 2014 1 0.0012 15 1.25 0.24 101.58 102.63 Collar 2014 2 0.0011 12 1 0.24 105.37 106.39 Enhanced Swap 2014 2 0.0011 12 1 0.24 105.37 106.39 Enhanced Swap 2014 2 0.0011 12 1 0.24 106.39 Collar 105.37 105.37 2014 2 0.0011 12 1 0.24 106.39 Collar 2014 3 0.0007 9 0.75 0.24 91.16 92.11 Enhanced Swap 2014 3 0.0007 9 0.75 0.24 91.16 92.11 Enhanced Swap 2014 3 3 0.0007 9 0.75 0.24 91.16 92.11 Collar 2014 3 0.0007 9 0.75 0.24 91.16 92.11 Collar 2014 4 0.0012 6 0.5 0.24 53.27 54.20 2014 4 0.0012 6 0.5 0.24 53.27 54.20 Enhanced Swap Enhanced Swap Three-Way Collar Three-Way Collar 2014 4 0.0012 6 0.5 0.24 53.27 54.20 2014 4 0.0012 6 0 0.5 0.24 53.27 54.20 Assignment You are given data on hedge positions of a real-life oil company, over eight consecutive quarters. Notice that some quarters may have more derivative positions than other quarters. Each row of the table above is a different derivative position. If there are multiple rows for the same quarter, that means the company held multiple positions during that quarter, "Fixed Price Swap" means a short position in a swap. In a row like that you will only see volume hedged. Price is irrelevant for calculations. "Enhanced swap" means the company sold a swap and sold a put on the same volume. You will see put strike (X) and the volume hedged. You will see the same volume appear twice, once as "Option Volume" and once as "Swap Volume." "Collar" means the company bought a put and sold a call. You will see the put strike, the call strike, and the volume hedged. "Three-Way Collar" means the company sold a put, bought a put, and sold a call. You will see the strike prices of all three options, and the volume hedged. Your assignment is to fill out the numbers in the sections highlighted in yellow, For each row, AGGREGATE DELTA = {(delta of sold put + delta of bought put + delta of sold call)*option volume + delta of swap * swap volume/expected production Delta of sold put, delta of bought put, and delta of sold call are calculated using the Black model for commodity options, same way we did it in the Hedge Ratio lab. Remember that delta of sold put is positive, delta of bought put is negative, and delta of sold call is negative. Watch the signs, Delta of a sold swap is (-1) per unit hedged. Other data: T, months T, years interest rate, annualized time to expiration, in months time to expiration, in years oil price volatility spot price of oil forward price of oil sigma - . * S cted Production SOLD PUT BOUGHT PUT SOLD CALL AGGREGATE DELTA d1 d2 delta d1 d2 delta d1 d2 delta 72,500 72,500 72,500 72,500 73,968 73,968 73,968 73,968 73,968 73,968 73,968 73,968 73,968 73,968 73,968 73,968 73,968 73,968 73,968 73,968 Year Quarter r T, months T, years sigma S F Strategy Sold put x Bought Put X Sold call X Option Volume Swap Volume Expected Production 15 12 2 2 3 9 9 6 APP14 58,000 58,000 58,000 58,000 14,000 16,000 1.25 1 1 0.75 0.5 1.25 1.25 1.25 1.25 15 15 65.21 68 15 80 85 96.75 102.1 2 15 12 12 1 65.75 68 8,000 16,000 1 2013 2013 2013 2013 2014 2014 2014 2014 2014 2014 2014 2014 2014 2014 2014 2014 2014 2014 2014 2014 2 2 0.0013 0.0015 0.0007 0.0007 0.0012 0.0012 0.0012 0.0012 0.0011 0.0011 0.0011 0.0011 0.0007 0.0007 0.0007 0.0007 0.0012 0.0012 0.0012 0.0012 0.18 97.23 0.18 96.56 0.18 102.33 0.18 98.42 0.24 101.58 0.24 101.58 0.24 101.58 0.24 101.58 0.24 105.37 0.24 105.37 0.24 105.37 0.24 105.37 0.24 91.16 0.24 91.16 0.24 91.16 0.24 91.16 0.24 53.27 0.24 53.27 0.24 53.27 0.24 53.27 98.29 97.61 103.28 99.35 102.63 102.63 102.63 102.63 106.39 106.39 106.39 106.39 92.11 92.11 92.11 92.11 54.20 54.20 54.20 54.20 Fixed Price Swap Fixed Price Swap Fixed Price Swap Fixed Price Swap Enhanced Swap Enhanced Swap Collar Collar Enhanced Swap Enhanced Swap Collar Collar Enhanced Swap Enhanced Swap Collar Collar Enhanced Swap Enhanced Swap Three-Way Collar Three-Way Collar 12 12 72,500 72,500 72,500 72,500 73,968 73,968 73,968 73,968 73,968 73,968 73,968 73,968 73,968 73,968 73,968 73,968 73,968 73,968 73,968 73,968 80 85 94.72 101.75 2 14,000 16,000 24,000 4,000 8,000 16,000 30,000 4,000 10,000 16,000 28,000 4,000 12,000 8,000 10,000 8,000 3 9 65.3 68 10,000 16,000 9 3 3 9 1 1 1 0.75 0.75 0.75 0.75 0.5 0.5 0.5 0.5 80 95.05 99.5 3 9 85 4 6 68 12,000 8,000 4 6 68 68 4 6 85 99 4 6 6 68 88 100.99 AGGREGATE DELTA SOLD PUT d1 d2 BOUGHT PUT d1 d2 SOLD CALL d1 d2 delta delta delta 26 27 Assignment 28 29 30 31 32 You are given data on hedge positions of a real-life oil company, over eight consecutive quarters. Notice that some quarters may have more derivative positions than other quarters. Each row of the table above is a different derivative position. If there are multiple rows for the same quarter, that means the company held multiple positions during that quarter. "Fixed Price Swap" means a short position in a swap. In a row like that you will only see volume hedged. Price is irrelevant for calculations. "Enhanced swap" means the company sold a swap and sold a put on the same volume. You will see put strike (x) and the volume hedged. You will see the same volume appear twice, once as "Option Volume" and once as "Swap Volume." "Collar" means the company bought a put and sold a call. You will see the put strike, the call strike, and the volume hedged. "Three-Way Collar" means the company sold a put, bought a put, and sold a call. You will see the strike prices of all three options, and the volume hedged. 33 34 35 36 37 Your assignment is to fill out the numbers in the sections highlighted in yellow. 38 39 For each row, AGGREGATE DELTA = {(delta of sold put + delta of bought put + delta of sold call)"option volume + delta of swapswap volume}/expected production 40 41 42 43 44 45 Ac = e-r(T-t)N(d) Delta of sold put, delta of bought put, and delta of sold call are calculated using the Black model for commodity options, same way we did it in the Hedge Ratio lab. 46 Remember that delta of sold put is positive, delta of bought put is negative, and delta of sold call is negative. Watch the signs. 47 Delta of a sold swap is (-1) per unit hedged. . 48 49 Other data: : 50 Ap = -e-r(T-t) N(-dy) 51 52 53 r interest rate, annualized T, months time to expiration, in months T, years time to expiration, in years sigma oil price volatility s spot price of oil F forward price of oil 54 55 56 57 Year Quarter r T, months T, years sigma S F Strategy 2013 1 0.0013 15 1.25 0.18 97.23 Fixed Price Swap 98.29 97.61 0.0015 12 1 0.18 96.56 2013 2013 2 3 0.0007 9 0.75 0.18 102.33 103.28 2013 4 0.0007 6 0.5 0.18 98.42 99.35 ND Fixed Price Swap Fixed Price Swap Fixed Price Swap Enhanced Swap Enhanced Swap Collar 2014 1 0.0012 15 1.25 0.24 101.58 102.63 2014 1 0.0012 15 1.25 0.24 101.58 102.63 2014 1 0.0012 15 1.25 0.24 101.58 102.63 2014 1 0.0012 15 1.25 0.24 101.58 102.63 Collar 2014 2 0.0011 12 1 0.24 105.37 106.39 Enhanced Swap 2014 2 0.0011 12 1 0.24 105.37 106.39 Enhanced Swap 2014 2 0.0011 12 1 0.24 106.39 Collar 105.37 105.37 2014 2 0.0011 12 1 0.24 106.39 Collar 2014 3 0.0007 9 0.75 0.24 91.16 92.11 Enhanced Swap 2014 3 0.0007 9 0.75 0.24 91.16 92.11 Enhanced Swap 2014 3 3 0.0007 9 0.75 0.24 91.16 92.11 Collar 2014 3 0.0007 9 0.75 0.24 91.16 92.11 Collar 2014 4 0.0012 6 0.5 0.24 53.27 54.20 2014 4 0.0012 6 0.5 0.24 53.27 54.20 Enhanced Swap Enhanced Swap Three-Way Collar Three-Way Collar 2014 4 0.0012 6 0.5 0.24 53.27 54.20 2014 4 0.0012 6 0 0.5 0.24 53.27 54.20 Assignment You are given data on hedge positions of a real-life oil company, over eight consecutive quarters. Notice that some quarters may have more derivative positions than other quarters. Each row of the table above is a different derivative position. If there are multiple rows for the same quarter, that means the company held multiple positions during that quarter, "Fixed Price Swap" means a short position in a swap. In a row like that you will only see volume hedged. Price is irrelevant for calculations. "Enhanced swap" means the company sold a swap and sold a put on the same volume. You will see put strike (X) and the volume hedged. You will see the same volume appear twice, once as "Option Volume" and once as "Swap Volume." "Collar" means the company bought a put and sold a call. You will see the put strike, the call strike, and the volume hedged. "Three-Way Collar" means the company sold a put, bought a put, and sold a call. You will see the strike prices of all three options, and the volume hedged. Your assignment is to fill out the numbers in the sections highlighted in yellow, For each row, AGGREGATE DELTA = {(delta of sold put + delta of bought put + delta of sold call)*option volume + delta of swap * swap volume/expected production Delta of sold put, delta of bought put, and delta of sold call are calculated using the Black model for commodity options, same way we did it in the Hedge Ratio lab. Remember that delta of sold put is positive, delta of bought put is negative, and delta of sold call is negative. Watch the signs, Delta of a sold swap is (-1) per unit hedged. Other data: T, months T, years interest rate, annualized time to expiration, in months time to expiration, in years oil price volatility spot price of oil forward price of oil sigma - . * S cted Production SOLD PUT BOUGHT PUT SOLD CALL AGGREGATE DELTA d1 d2 delta d1 d2 delta d1 d2 delta 72,500 72,500 72,500 72,500 73,968 73,968 73,968 73,968 73,968 73,968 73,968 73,968 73,968 73,968 73,968 73,968 73,968 73,968 73,968 73,968 Year Quarter r T, months T, years sigma S F Strategy Sold put x Bought Put X Sold call X Option Volume Swap Volume Expected Production 15 12 2 2 3 9 9 6 APP14 58,000 58,000 58,000 58,000 14,000 16,000 1.25 1 1 0.75 0.5 1.25 1.25 1.25 1.25 15 15 65.21 68 15 80 85 96.75 102.1 2 15 12 12 1 65.75 68 8,000 16,000 1 2013 2013 2013 2013 2014 2014 2014 2014 2014 2014 2014 2014 2014 2014 2014 2014 2014 2014 2014 2014 2 2 0.0013 0.0015 0.0007 0.0007 0.0012 0.0012 0.0012 0.0012 0.0011 0.0011 0.0011 0.0011 0.0007 0.0007 0.0007 0.0007 0.0012 0.0012 0.0012 0.0012 0.18 97.23 0.18 96.56 0.18 102.33 0.18 98.42 0.24 101.58 0.24 101.58 0.24 101.58 0.24 101.58 0.24 105.37 0.24 105.37 0.24 105.37 0.24 105.37 0.24 91.16 0.24 91.16 0.24 91.16 0.24 91.16 0.24 53.27 0.24 53.27 0.24 53.27 0.24 53.27 98.29 97.61 103.28 99.35 102.63 102.63 102.63 102.63 106.39 106.39 106.39 106.39 92.11 92.11 92.11 92.11 54.20 54.20 54.20 54.20 Fixed Price Swap Fixed Price Swap Fixed Price Swap Fixed Price Swap Enhanced Swap Enhanced Swap Collar Collar Enhanced Swap Enhanced Swap Collar Collar Enhanced Swap Enhanced Swap Collar Collar Enhanced Swap Enhanced Swap Three-Way Collar Three-Way Collar 12 12 72,500 72,500 72,500 72,500 73,968 73,968 73,968 73,968 73,968 73,968 73,968 73,968 73,968 73,968 73,968 73,968 73,968 73,968 73,968 73,968 80 85 94.72 101.75 2 14,000 16,000 24,000 4,000 8,000 16,000 30,000 4,000 10,000 16,000 28,000 4,000 12,000 8,000 10,000 8,000 3 9 65.3 68 10,000 16,000 9 3 3 9 1 1 1 0.75 0.75 0.75 0.75 0.5 0.5 0.5 0.5 80 95.05 99.5 3 9 85 4 6 68 12,000 8,000 4 6 68 68 4 6 85 99 4 6 6 68 88 100.99 AGGREGATE DELTA SOLD PUT d1 d2 BOUGHT PUT d1 d2 SOLD CALL d1 d2 delta delta delta 26 27 Assignment 28 29 30 31 32 You are given data on hedge positions of a real-life oil company, over eight consecutive quarters. Notice that some quarters may have more derivative positions than other quarters. Each row of the table above is a different derivative position. If there are multiple rows for the same quarter, that means the company held multiple positions during that quarter. "Fixed Price Swap" means a short position in a swap. In a row like that you will only see volume hedged. Price is irrelevant for calculations. "Enhanced swap" means the company sold a swap and sold a put on the same volume. You will see put strike (x) and the volume hedged. You will see the same volume appear twice, once as "Option Volume" and once as "Swap Volume." "Collar" means the company bought a put and sold a call. You will see the put strike, the call strike, and the volume hedged. "Three-Way Collar" means the company sold a put, bought a put, and sold a call. You will see the strike prices of all three options, and the volume hedged. 33 34 35 36 37 Your assignment is to fill out the numbers in the sections highlighted in yellow. 38 39 For each row, AGGREGATE DELTA = {(delta of sold put + delta of bought put + delta of sold call)"option volume + delta of swapswap volume}/expected production 40 41 42 43 44 45 Ac = e-r(T-t)N(d) Delta of sold put, delta of bought put, and delta of sold call are calculated using the Black model for commodity options, same way we did it in the Hedge Ratio lab. 46 Remember that delta of sold put is positive, delta of bought put is negative, and delta of sold call is negative. Watch the signs. 47 Delta of a sold swap is (-1) per unit hedged. . 48 49 Other data: : 50 Ap = -e-r(T-t) N(-dy) 51 52 53 r interest rate, annualized T, months time to expiration, in months T, years time to expiration, in years sigma oil price volatility s spot price of oil F forward price of oil 54 55 56 57