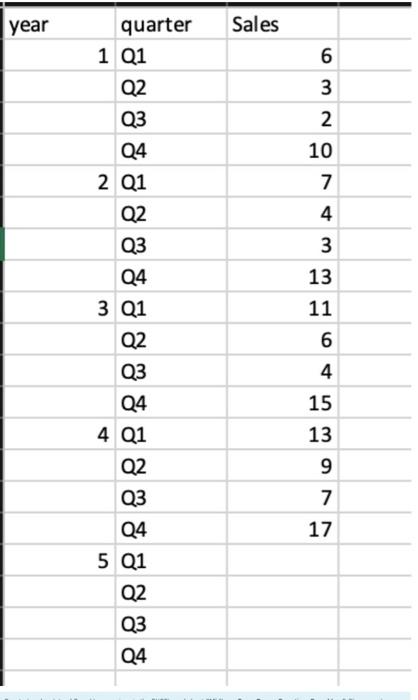
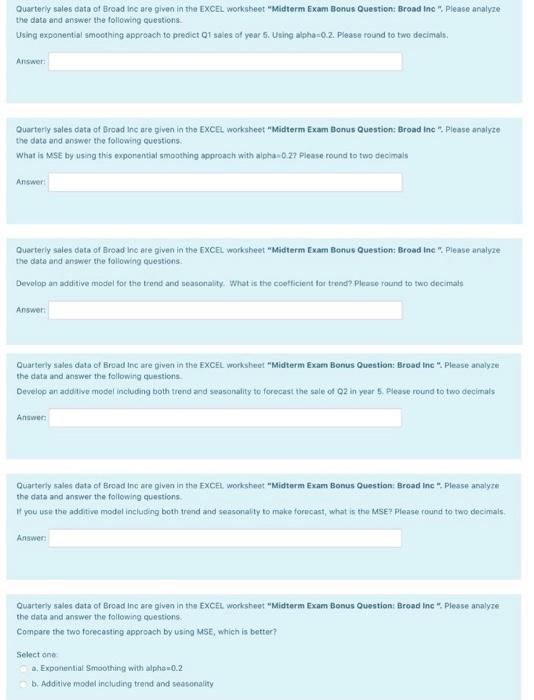
year Sales 6 3 NW 2 10 7 4 3 13 11 quarter 1 Q1 Q2 Q3 Q4 2 Q1 Q2 Q3 Q4 3 Q1 Q2 Q3 Q4 4 Q1 Q2 Q3 Q4 5 Q1 Q2 Q3 Q4 09 6 4 15 13 9 7 17 Quarterly sales data of Broad Inc are given in the EXCEL worksheet "Midterm Exam Bonus Question: Broad Ine". Please analyze the date and answer the following questions. Using exponential smoothing approach to predict 01 sales of year 5. Using aipha=0.2. Please round to two decimal: Answer Quarterly sales data of Broad tnc are given in the EXCEL worksheet "Midterm Exam Bonus Question: Broad Inc". Please analyze the data and answer the following questions. What Is Me by using this exponential smoothing approach with alpha=0.2? Please round to two decimals Answer: Quarterly sales data of Broad incare given in the EXCEL worksheet "Midterm Exam Bonus Question: Broad Inc. Please analyze the date and answer the following questions. Develop an additive model for the trend and seasonality. What is the coofficient for trend? Please round to two decimals Answer: Quarterly sales data of Broad Inc are given in the EXCEL worksheet "Midterm Exam Bonus Question: Broad Inc". Please analyze the data and answer the following questions Develop an additive model including both trend and seasonality to forecast the sale of O2 in years. Please round to two decimals Answer Quarterly sales data of Broad Inc are given in the EXCEL. Worksheet "Midterm Exam Bonus Question: Broad Inc". Please analyse the data and answer the following questions. If you use the additiva model including both trend and seasonality to make forncast, what is the MSEY Please round to two decimals. Answers Quarterly sales data of Broad inc are given in the EXCEL worksheet "Midterm Exam Bonus Question: Broad Inc. Please analyze the data and answer the following questions Compare the two forecasting approach by using Mse, which is better? Select one a. Exponential Smoothing with alpha=0.2 b. Additive model including trend and seasonality


