

Answered step by step
Verified Expert Solution
Question
1 Approved Answer
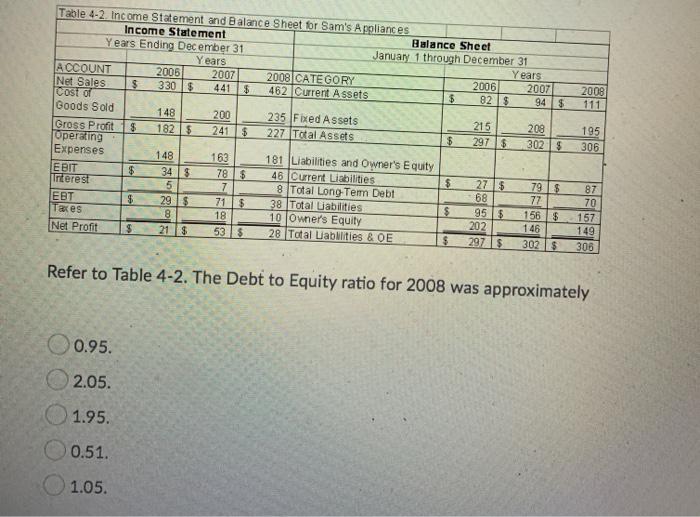
Years 2008 Table 4-2. Income Statement and Balance Sheet for Sam's Appliances Income Statement Balance Sheet Years Ending December 31 January 1 through December 31
Step by Step Solution
There are 3 Steps involved in it
Step: 1

Get Instant Access to Expert-Tailored Solutions
See step-by-step solutions with expert insights and AI powered tools for academic success
Step: 2

Step: 3
Ace Your Homework with AI
Get the answers you need in no time with our AI-driven, step-by-step assistance
Get Started
Take Charge Of Your Money Now Essential Strategies For Winning In Any Financial Climate
Authors: A.J. Monte, Rick Swope
1st Edition
0345517334, 978-0345517333