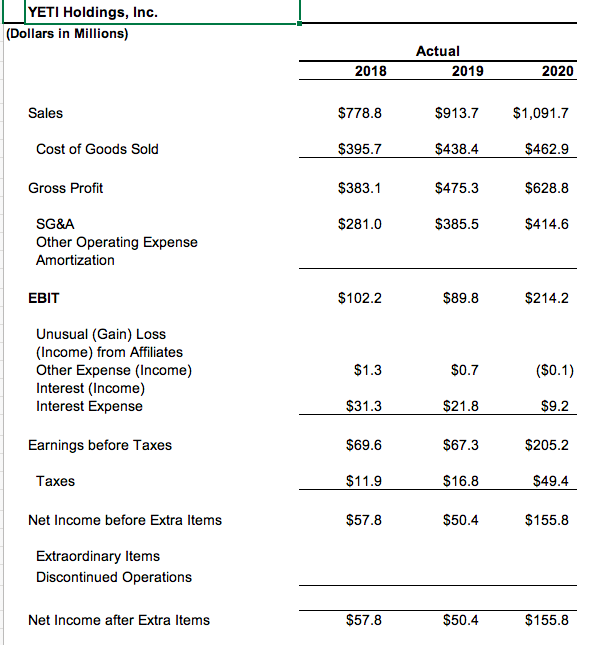
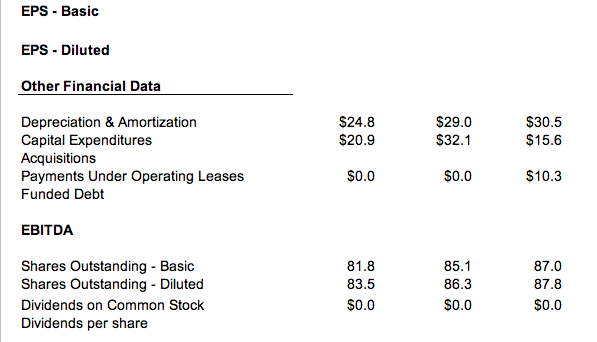
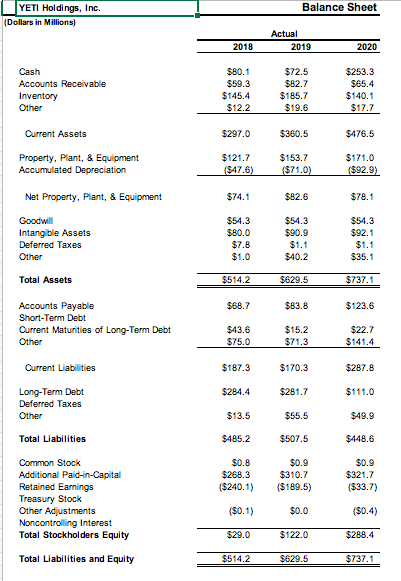
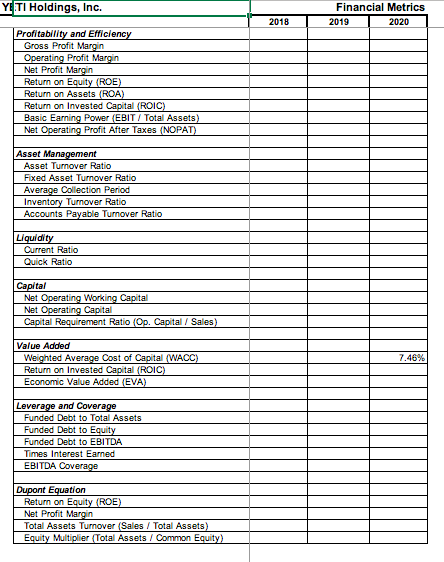
YETI Holdings, Inc. (Dollars in Millions) Actual 2018 2019 2020 Sales $778.8 $913.7 $1,091.7 Cost of Goods Sold $395.7 $438.4 $462.9 Gross Profit $383.1 $475.3 $628.8 $281.0 $385.5 $414.6 SG&A Other Operating Expense Amortization EBIT $102.2 $89.8 $214.2 Unusual (Gain) Loss (Income) from Affiliates Other Expense (Income) Interest (Income) Interest Expense $1.3 $0.7 ($0.1) $31.3 $21.8 $9.2 Earnings before Taxes $69.6 $67.3 $205.2 Taxes $11.9 $16.8 $49.4 Net Income before Extra Items $57.8 $50.4 $155.8 Extraordinary Items Discontinued Operations Net Income after Extra Items $57.8 $50.4 $155.8 EPS - Basic EPS - Diluted Other Financial Data $24.8 $20.9 $29.0 $32.1 $30.5 $15.6 Depreciation & Amortization Capital Expenditures Acquisitions Payments Under Operating Leases Funded Debt $0.0 $0.0 $10.3 EBITDA 81.8 85.1 87.0 83.5 86.3 87.8 Shares Outstanding - Basic Shares Outstanding - Diluted Dividends on Common Stock Dividends per share $0.0 $0.0 $0.0 Balance Sheet YETI Holdings, Inc. (Dollars in Millions) Actual 2018 2019 2020 Cash Accounts Receivable Inventory Other $80.1 $59.3 $145.4 $12.2 $72.5 $82.7 $185.7 $19.6 $253.3 $65.4 $140.1 $17.7 Current Assets $297.0 $360.5 $476.5 Property, Plant, & Equipment Accumulated Depreciation $121.7 ($47.6) $153.7 ($71.0) $171.0 ($92.9) Net Property, Plant, & Equipment $74.1 $82.6 $78.1 Goodwill Intangible Assets Deferred Taxes $54.3 $80.0 $7.8 $1.0 $54.3 $90.9 $1.1 $40.2 $54.3 $92.1 $1.1 $35.1 Other Total Assets $514.2 $629.5 $737.1 $68.7 $83.8 $123.6 Accounts Payable Short-Term Debt Current Maturities of Long-Term Debt Other $43.6 $75.0 $15.2 $71.3 $22.7 $141.4 Current Liabilities $187.3 $170.3 $287.8 $284.4 $281.7 $111.0 Long-Term Debt Deferred Taxes Other $13.5 $55.5 $49.9 Total Liabilities $485.2 $507.5 $448.6 $0.8 $268.3 ($240.1) $0.9 $310.7 ($189.5) $0.9 $321.7 ($33.7) Common Stock Additional Paid-in-Capital Retained Earnings Treasury Stock Other Adjustments Noncontrolling Interest Total Stockholders Equity ($0.1) $0.0 ($0.4) $29.0 $122.0 $288.4 Total Liabilities and Equity $514.2 $629.5 $737.1 YETI Holdings, Inc. Financial Metrics 2018 2019 2020 Profitability and Efficiency Gross Profit Margin Operating Profit Margin Net Profit Margin Return on Equity (ROE) Return on Assets (ROA) Return on Invested Capital (ROIC) Basic Earning Power (EBIT / Total Assets) Net Operating Profit After Taxes (NOPAT) Asset Management Asset Turnover Ratio Fixed Asset Turnover Ratio Average Collection Period Inventory Turnover Ratio Accounts Payable Turnover Ratio Liquidity Ourrent Ratio Quick Ratio Capital Net Operating Working Capital Net Operating Capital Capital Requirement Ratio (Op. Capital / Sales) Value Added 7.46% Weighted Average Cost of Capital (WACC) Return on invested Capital (ROIC) Economic Value Added (EVA) Leverage and Coverage Funded Debt to Total Assets Funded Debt to Equity Funded Debt to EBITDA Times Interest Earned EBITDA Coverage Dupont Equation Return on Equity (ROE) Net Profit Margin Total Assets Turnover (Sales/Total Assets) Equity Multiplier Total Assets / Common Equity) YETI Holdings, Inc. (Dollars in Millions) Actual 2018 2019 2020 Sales $778.8 $913.7 $1,091.7 Cost of Goods Sold $395.7 $438.4 $462.9 Gross Profit $383.1 $475.3 $628.8 $281.0 $385.5 $414.6 SG&A Other Operating Expense Amortization EBIT $102.2 $89.8 $214.2 Unusual (Gain) Loss (Income) from Affiliates Other Expense (Income) Interest (Income) Interest Expense $1.3 $0.7 ($0.1) $31.3 $21.8 $9.2 Earnings before Taxes $69.6 $67.3 $205.2 Taxes $11.9 $16.8 $49.4 Net Income before Extra Items $57.8 $50.4 $155.8 Extraordinary Items Discontinued Operations Net Income after Extra Items $57.8 $50.4 $155.8 EPS - Basic EPS - Diluted Other Financial Data $24.8 $20.9 $29.0 $32.1 $30.5 $15.6 Depreciation & Amortization Capital Expenditures Acquisitions Payments Under Operating Leases Funded Debt $0.0 $0.0 $10.3 EBITDA 81.8 85.1 87.0 83.5 86.3 87.8 Shares Outstanding - Basic Shares Outstanding - Diluted Dividends on Common Stock Dividends per share $0.0 $0.0 $0.0 Balance Sheet YETI Holdings, Inc. (Dollars in Millions) Actual 2018 2019 2020 Cash Accounts Receivable Inventory Other $80.1 $59.3 $145.4 $12.2 $72.5 $82.7 $185.7 $19.6 $253.3 $65.4 $140.1 $17.7 Current Assets $297.0 $360.5 $476.5 Property, Plant, & Equipment Accumulated Depreciation $121.7 ($47.6) $153.7 ($71.0) $171.0 ($92.9) Net Property, Plant, & Equipment $74.1 $82.6 $78.1 Goodwill Intangible Assets Deferred Taxes $54.3 $80.0 $7.8 $1.0 $54.3 $90.9 $1.1 $40.2 $54.3 $92.1 $1.1 $35.1 Other Total Assets $514.2 $629.5 $737.1 $68.7 $83.8 $123.6 Accounts Payable Short-Term Debt Current Maturities of Long-Term Debt Other $43.6 $75.0 $15.2 $71.3 $22.7 $141.4 Current Liabilities $187.3 $170.3 $287.8 $284.4 $281.7 $111.0 Long-Term Debt Deferred Taxes Other $13.5 $55.5 $49.9 Total Liabilities $485.2 $507.5 $448.6 $0.8 $268.3 ($240.1) $0.9 $310.7 ($189.5) $0.9 $321.7 ($33.7) Common Stock Additional Paid-in-Capital Retained Earnings Treasury Stock Other Adjustments Noncontrolling Interest Total Stockholders Equity ($0.1) $0.0 ($0.4) $29.0 $122.0 $288.4 Total Liabilities and Equity $514.2 $629.5 $737.1 YETI Holdings, Inc. Financial Metrics 2018 2019 2020 Profitability and Efficiency Gross Profit Margin Operating Profit Margin Net Profit Margin Return on Equity (ROE) Return on Assets (ROA) Return on Invested Capital (ROIC) Basic Earning Power (EBIT / Total Assets) Net Operating Profit After Taxes (NOPAT) Asset Management Asset Turnover Ratio Fixed Asset Turnover Ratio Average Collection Period Inventory Turnover Ratio Accounts Payable Turnover Ratio Liquidity Ourrent Ratio Quick Ratio Capital Net Operating Working Capital Net Operating Capital Capital Requirement Ratio (Op. Capital / Sales) Value Added 7.46% Weighted Average Cost of Capital (WACC) Return on invested Capital (ROIC) Economic Value Added (EVA) Leverage and Coverage Funded Debt to Total Assets Funded Debt to Equity Funded Debt to EBITDA Times Interest Earned EBITDA Coverage Dupont Equation Return on Equity (ROE) Net Profit Margin Total Assets Turnover (Sales/Total Assets) Equity Multiplier Total Assets / Common Equity)