

Answered step by step
Verified Expert Solution
Question
1 Approved Answer
You are a stock day trader and investing in four stocks (A, B, C, and D) for only one day. The purchase prices and
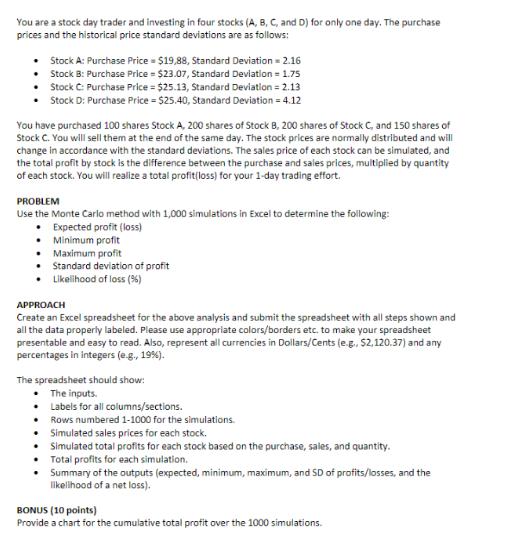
You are a stock day trader and investing in four stocks (A, B, C, and D) for only one day. The purchase prices and the historical price standard deviations are as follows: Stock A: Purchase Price = $19,88, Standard Deviation = 2.16 Stock B: Purchase Price = $23.07, Standard Deviation = 1.75 Stock C: Purchase Price = $25.13, Standard Deviation = 2.13 Stock D: Purchase Price = $25.40, Standard Deviation = 4.12 You have purchased 100 shares Stock A, 200 shares of Stock B, 200 shares of Stock C, and 150 shares of Stock C. You will sell them at the end of the same day. The stock prices are normally distributed and will change in accordance with the standard deviations. The sales price of each stock can be simulated, and the total profit by stock is the difference between the purchase and sales prices, multiplied by quantity of each stock. You will realize a total profit(loss) for your 1-day trading effort. PROBLEM Use the Monte Carlo method with 1,000 simulations in Excel to determine the following: Expected profit (loss) Minimum profit Maximum profit Standard deviation of profit Likelihood of loss (%) APPROACH Create an Excel spreadsheet for the above analysis and submit the spreadsheet with all steps shown and all the data properly labeled. Please use appropriate colors/borders etc. to make your spreadsheet presentable and easy to read. Also, represent all currencies in Dollars/Cents (e.g., $2,120.37) and any percentages in integers (e.g., 19%). The spreadsheet should show: The inputs. Labels for all columns/sections. Rows numbered 1-1000 for the simulations. Simulated sales prices for each stock. Simulated total profits for each stock based on the purchase, sales, and quantity. Total profits for each simulation. Summary of the outputs (expected, minimum, maximum, and SD of profits/losses, and the likelihood of a net loss). BONUS (10 points) Provide a chart for the cumulative total profit over the 1000 simulations.
Step by Step Solution
★★★★★
3.44 Rating (151 Votes )
There are 3 Steps involved in it
Step: 1
Monte Carlo Simulation for Stock Day Trading This spreadsheet simulates 1000 scenarios of stock price movements for a 1day trade and calculates the pr...
Get Instant Access to Expert-Tailored Solutions
See step-by-step solutions with expert insights and AI powered tools for academic success
Step: 2

Step: 3
Ace Your Homework with AI
Get the answers you need in no time with our AI-driven, step-by-step assistance
Get Started
Microeconomics
Authors: Paul Krugman, Robin Wells
3rd edition
978-1429283427, 1429283424, 978-1464104213, 1464104212, 978-1429283434