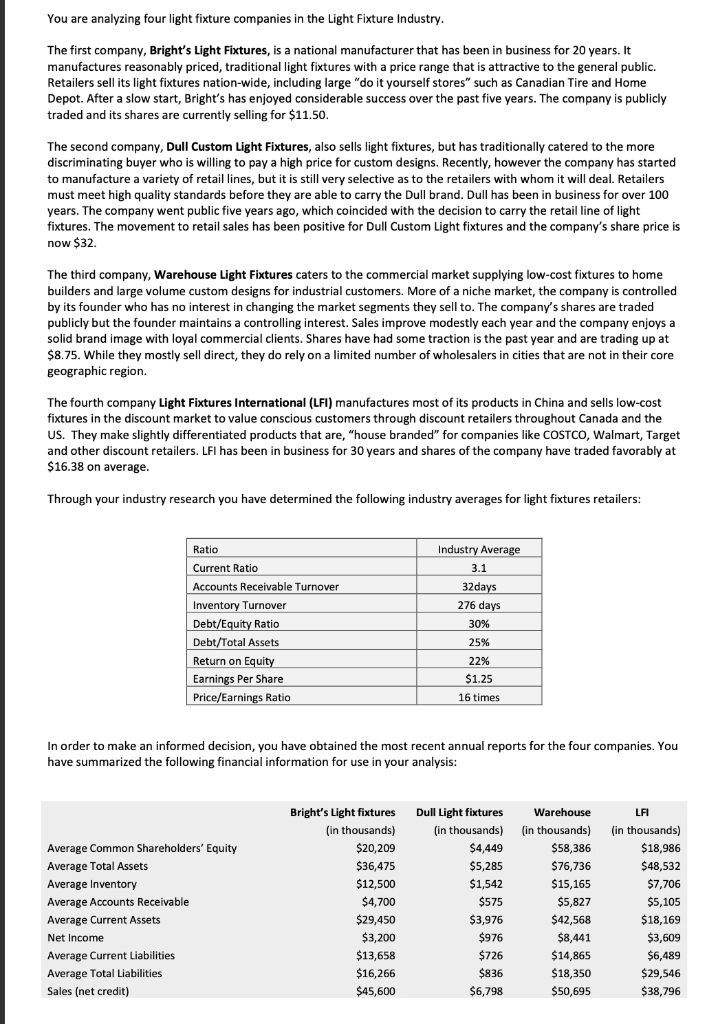
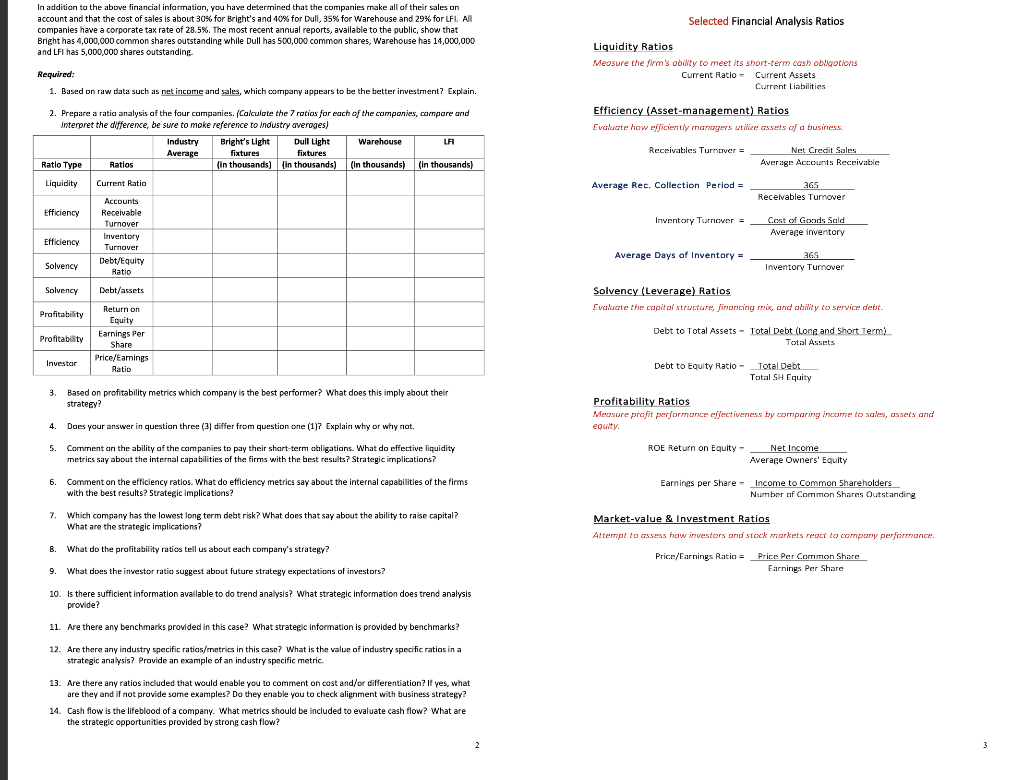
You are analyzing four light fixture companies in the Light Fixture Industry. The first company, Bright's Light Fixtures, is a national manufacturer that has been in business for 20 years. It manufactures reasonably priced, traditional light fixtures with a price range that is attractive to the general public. Retailers sell its light fixtures nation-wide, including large "do it yourself stores" such as Canadian Tire and Home Depot. After a slow start, Bright's has enjoyed considerable success over the past five years. The company is publicly traded and its shares are currently selling for $11.50. The second company, Dull Custom Light Fixtures, also sells light fixtures, but has traditionally catered to the more discriminating buyer who is willing to pay a high price for custom designs. Recently, however the company has started to manufacture a variety of retail lines, but it is still very selective as to the retailers with whom it will deal. Retailers must meet high quality standards before they are able to carry the Dull brand. Dull has been in business for over 100 years. The company went public five years ago, which coincided with the decision to carry the retail line of light fixtures. The movement to retail sales has been positive for Dull Custom Light fixtures and the company's share price is now \$32. The third company, Warehouse Light Fixtures caters to the commercial market supplying low-cost fixtures to home builders and large volume custom designs for industrial customers. More of a niche market, the company is controlled by its founder who has no interest in changing the market segments they sell to. The company's shares are traded publicly but the founder maintains a controlling interest. Sales improve modestly each year and the company enjoys a solid brand image with loyal commercial clients. Shares have had some traction is the past year and are trading up at \$8.75. While they mostly sell direct, they do rely on a limited number of wholesalers in cities that are not in their core geographic region. The fourth company Light Fixtures International (LFI) manufactures most of its products in China and sells low-cost fixtures in the discount market to value conscious customers through discount retailers throughout Canada and the US. They make slightly differentiated products that are, "house branded" for companies like COSTCO, Walmart, Target and other discount retailers. LFI has been in business for 30 years and shares of the company have traded favorably at $16.38 on average. Through your industry research you have determined the following industry averages for light fixtures retailers: In order to make an informed decision, you have obtained the most recent annual reports for the four companies. You have summarized the following financial information for use in your analysis: In addition to the above financial infarmation, you have determined that the companies make all of their sales on account and that the cost of sales is about 305 for Bright's and 40% for Dull, 35% for Warehouse and 293 for LFI. All companies have a corporate tax rate of 28.5%. The most recent annual reports, avallable to the public, show that Bright has 4,000,000 common shares outstandine whille Dull has 500,000 common shares, Warehouse has 14,000,000 and LFI has 5,000,000 shares outstanding. Selected Financial Analysis Ratios Required: 1. Based on raw data such as net income and sales, which company appears to be the better investrment? Explain. Liquidity Ratios Meosure the firm's obiity to meet its short-term cash obligotions Current Ratio - Current Assets Curront Liabilitios 2. Prepare a ratio analysis af the faur campanies. (Calcuiate the 7 rotias for each of the companias, compare and interoret the dlfference, be sure to moke reference to industry averoges) Efficiency (Asset-management) Ratios Evalucte how eijacientiy managers ut ilize cassets of a business 3. Based on profitability metrics which company is the best performer? What does this imply about their strateey? Profitability Ratios Measure profit performance effectiveness by comparing incame to scales, asse's and equity. ROE Return on Equity =AverageOwnersEquityNetIncome Earnings per Share =NumberafCommonSharesOutstandingIncometoCommon5hareholders 5. Carnment an the ability af the companies to pay their shart-term obligatians. What do effective liquidity metries say about the internal capabilities of the firms with the best results? Strategic implications? 6. Comment on the efficiency ratios. What do efficiency metrics say about toe best results? 5trategic implications? with the best 7. Which company has the lowest long term debt risk? What does that say abo the strategic implications? B. What are do the profitability ratios tell us about each company's strategy? B. What 9. What does the investor ratio suggest about future strategy expectations of investors? Market-value \& Investment Ratios Attempt to cassess how investors and stock markets reoct to compary performance. 10. Is there sufficient information avallable to do trend analysis? What strateaic information does trend analysis provide? 11. Are there any benchmarks provided in this case? What strateeic information is provided by benchmarks? 12. Are there any industry specific ratios/metrics in this case? What is the value of industry specific ratios in a strategic analysis? Provide an example of an industry specific metric. 13. Are there any ratios included that would enable you to comment on cost and/or differentiation? If yes, what are they and if not provide some examples? Do they enable you to check alignment with business strategy? 14. Cash flow is the lifeblood of a company. What metrics should be included to evaluate cash flow? What are the strategic opportunities provided by strong cash flow? You are analyzing four light fixture companies in the Light Fixture Industry. The first company, Bright's Light Fixtures, is a national manufacturer that has been in business for 20 years. It manufactures reasonably priced, traditional light fixtures with a price range that is attractive to the general public. Retailers sell its light fixtures nation-wide, including large "do it yourself stores" such as Canadian Tire and Home Depot. After a slow start, Bright's has enjoyed considerable success over the past five years. The company is publicly traded and its shares are currently selling for $11.50. The second company, Dull Custom Light Fixtures, also sells light fixtures, but has traditionally catered to the more discriminating buyer who is willing to pay a high price for custom designs. Recently, however the company has started to manufacture a variety of retail lines, but it is still very selective as to the retailers with whom it will deal. Retailers must meet high quality standards before they are able to carry the Dull brand. Dull has been in business for over 100 years. The company went public five years ago, which coincided with the decision to carry the retail line of light fixtures. The movement to retail sales has been positive for Dull Custom Light fixtures and the company's share price is now \$32. The third company, Warehouse Light Fixtures caters to the commercial market supplying low-cost fixtures to home builders and large volume custom designs for industrial customers. More of a niche market, the company is controlled by its founder who has no interest in changing the market segments they sell to. The company's shares are traded publicly but the founder maintains a controlling interest. Sales improve modestly each year and the company enjoys a solid brand image with loyal commercial clients. Shares have had some traction is the past year and are trading up at \$8.75. While they mostly sell direct, they do rely on a limited number of wholesalers in cities that are not in their core geographic region. The fourth company Light Fixtures International (LFI) manufactures most of its products in China and sells low-cost fixtures in the discount market to value conscious customers through discount retailers throughout Canada and the US. They make slightly differentiated products that are, "house branded" for companies like COSTCO, Walmart, Target and other discount retailers. LFI has been in business for 30 years and shares of the company have traded favorably at $16.38 on average. Through your industry research you have determined the following industry averages for light fixtures retailers: In order to make an informed decision, you have obtained the most recent annual reports for the four companies. You have summarized the following financial information for use in your analysis: In addition to the above financial infarmation, you have determined that the companies make all of their sales on account and that the cost of sales is about 305 for Bright's and 40% for Dull, 35% for Warehouse and 293 for LFI. All companies have a corporate tax rate of 28.5%. The most recent annual reports, avallable to the public, show that Bright has 4,000,000 common shares outstandine whille Dull has 500,000 common shares, Warehouse has 14,000,000 and LFI has 5,000,000 shares outstanding. Selected Financial Analysis Ratios Required: 1. Based on raw data such as net income and sales, which company appears to be the better investrment? Explain. Liquidity Ratios Meosure the firm's obiity to meet its short-term cash obligotions Current Ratio - Current Assets Curront Liabilitios 2. Prepare a ratio analysis af the faur campanies. (Calcuiate the 7 rotias for each of the companias, compare and interoret the dlfference, be sure to moke reference to industry averoges) Efficiency (Asset-management) Ratios Evalucte how eijacientiy managers ut ilize cassets of a business 3. Based on profitability metrics which company is the best performer? What does this imply about their strateey? Profitability Ratios Measure profit performance effectiveness by comparing incame to scales, asse's and equity. ROE Return on Equity =AverageOwnersEquityNetIncome Earnings per Share =NumberafCommonSharesOutstandingIncometoCommon5hareholders 5. Carnment an the ability af the companies to pay their shart-term obligatians. What do effective liquidity metries say about the internal capabilities of the firms with the best results? Strategic implications? 6. Comment on the efficiency ratios. What do efficiency metrics say about toe best results? 5trategic implications? with the best 7. Which company has the lowest long term debt risk? What does that say abo the strategic implications? B. What are do the profitability ratios tell us about each company's strategy? B. What 9. What does the investor ratio suggest about future strategy expectations of investors? Market-value \& Investment Ratios Attempt to cassess how investors and stock markets reoct to compary performance. 10. Is there sufficient information avallable to do trend analysis? What strateaic information does trend analysis provide? 11. Are there any benchmarks provided in this case? What strateeic information is provided by benchmarks? 12. Are there any industry specific ratios/metrics in this case? What is the value of industry specific ratios in a strategic analysis? Provide an example of an industry specific metric. 13. Are there any ratios included that would enable you to comment on cost and/or differentiation? If yes, what are they and if not provide some examples? Do they enable you to check alignment with business strategy? 14. Cash flow is the lifeblood of a company. What metrics should be included to evaluate cash flow? What are the strategic opportunities provided by strong cash flow