

Question
You are asked to evaluate the performance of two classification models, M1 and M2. The following table shows the probabilities obtained by applying the models
You are asked to evaluate the performance of two classification models, M1 and M2. The following table shows the probabilities obtained by applying the models to the test set:
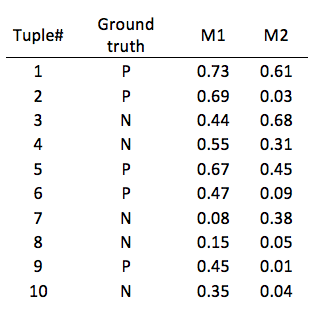
Plot the ROC curve for both M1 and M2 on the same graph. Which model do you think is better?
For model M1, suppose you choose the cutoff threshold to be t = 0.5. In other words, any test instances whose posterior probability is greater than t will be classified as a positive example.
(a) Compute the precision, recall, and F-measure for the model at this threshold value.
(b) Repeat the analysis of the above question (question-2) using the same cutoff threshold on model M2.
(c) Compare the F-measure results for both models. Which model is better? Are the results consistent with what you expect from the ROC curve?
Ground M M2 Tuple# truth 1 0.73 0.61 0.69 0.03 0.44 0.68 0.55 0.31 0.67 0.45 0.47 0.09 0.08 0.38 0.15 0.05 0.45 0.01 0.35 0.04 4 6 10 Ground M M2 Tuple# truth 1 0.73 0.61 0.69 0.03 0.44 0.68 0.55 0.31 0.67 0.45 0.47 0.09 0.08 0.38 0.15 0.05 0.45 0.01 0.35 0.04 4 6 10
Step by Step Solution
There are 3 Steps involved in it
Step: 1

Get Instant Access to Expert-Tailored Solutions
See step-by-step solutions with expert insights and AI powered tools for academic success
Step: 2

Step: 3
Ace Your Homework with AI
Get the answers you need in no time with our AI-driven, step-by-step assistance
Get Started
Advances In Databases 11th British National Conference On Databases Bncod 11 Keele Uk July 7 9 1993 Proceedings Lncs 696
Authors: Michael F. Worboys ,Anna F. Grundy
1993rd Edition
3540569219, 978-3540569213