

Answered step by step
Verified Expert Solution
Question
1 Approved Answer
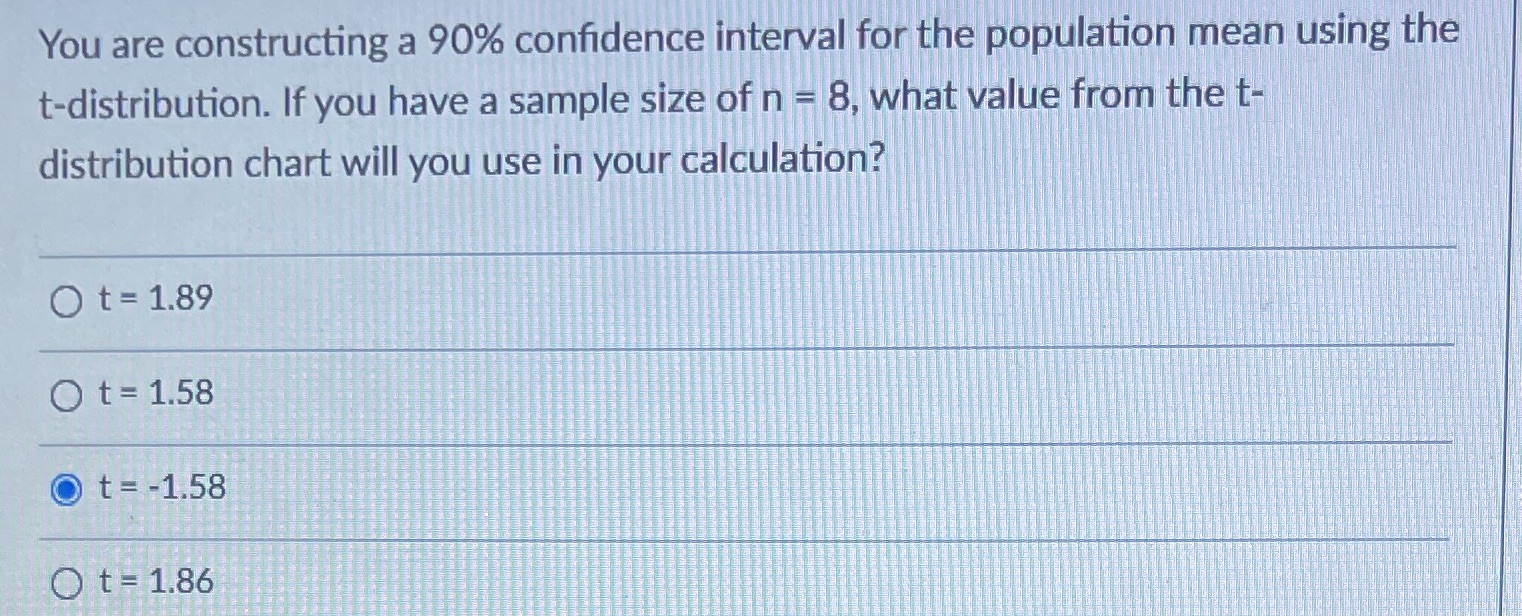
You are constructing a 90% confidence interval for the population mean using the t-distribution. If you have a sample size of n = 8, what
Step by Step Solution
There are 3 Steps involved in it
Step: 1

Get Instant Access to Expert-Tailored Solutions
See step-by-step solutions with expert insights and AI powered tools for academic success
Step: 2

Step: 3
Ace Your Homework with AI
Get the answers you need in no time with our AI-driven, step-by-step assistance
Get Started
Mathematical Excursions
Authors: Richard N Aufmann, , Joanne Lockwood, Richard D Nation, Daniel K Clegg
3rd Edition
1305161793, 9781305161795