

Question
You are evaluating the HomeNet project under the following assumptions: Sales of50,000units in year 1 increasing by54,000units per year over the life of the project,
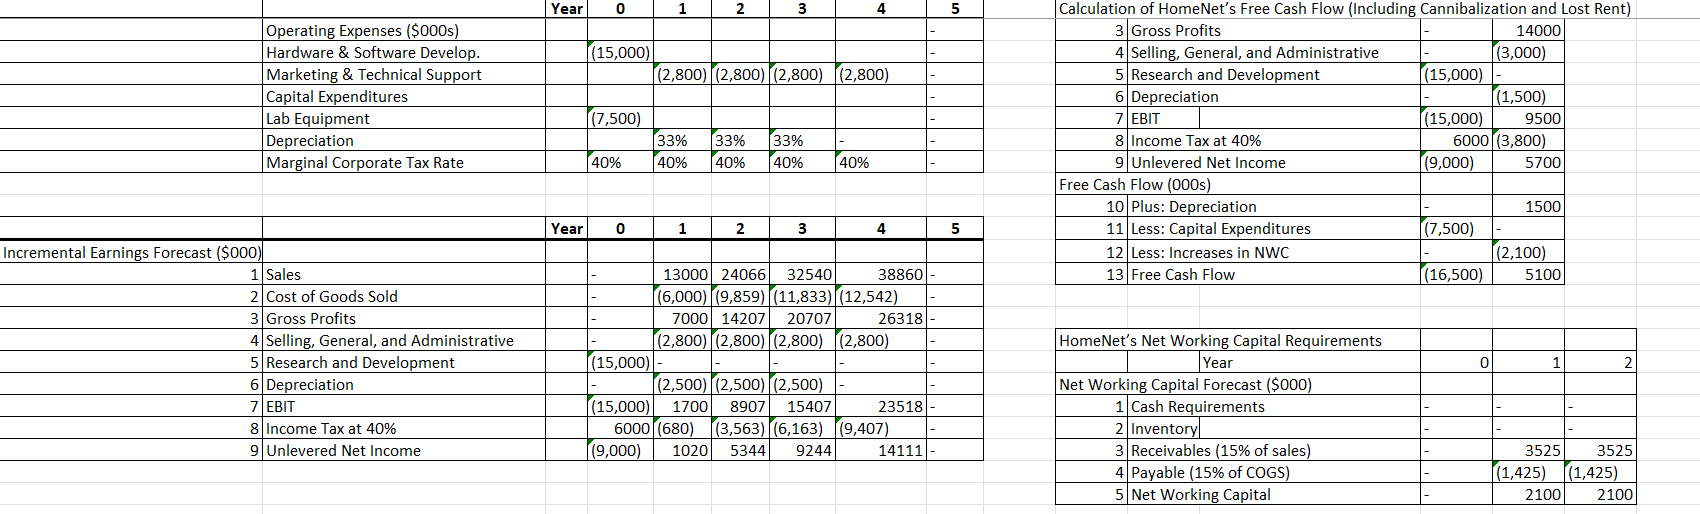
You are evaluating the HomeNet project under the following assumptions: Sales of50,000units in year 1 increasing by54,000units per year over the life of the project, a year 1 sales price of$260/unit, decreasing by11% annually and a year 1 cost of$120/unit decreasing by21%annually. In addition, new tax laws allow you to depreciate the equipment, costing$7.5 million, over three years using straight-line depreciation. Research and development expenditures total$15 million in year 0 and selling, general, and administrative expenses are$2.8 million per year (assuming there is no cannibalization). Under these assumptions the unlevered net income is shown in the table: . Suppose that HomeNet will have no incremental cash or inventory requirements (products will be shipped directly from the contract manufacturer to customers). However, receivables related to HomeNet are expected to account for15% of annual sales, and payables are expected to be15% of the annual cost of goods sold. a. Calculate HomeNet's net working capital requirements (that is, reproduce Table 8.4 under the assumptions given).b. Calculate HomeNet's FCF (that is, reproduce Table 8.3 under the same assumptions).
a. Calculate HomeNet's net working capital requirements (that is, reproduce Table 8.4 under the assumptions given) The net working capital for year 1 is $ enter your response here. (Round to the nearest thousand dollars.)
Step by Step Solution
There are 3 Steps involved in it
Step: 1

Get Instant Access to Expert-Tailored Solutions
See step-by-step solutions with expert insights and AI powered tools for academic success
Step: 2

Step: 3
Ace Your Homework with AI
Get the answers you need in no time with our AI-driven, step-by-step assistance
Get Started
Your Financial Well Being How To Get Your Financial Well Being With Smart Spending Habits
Authors: Fransisca Patten
1st Edition
979-8388729705