

Question
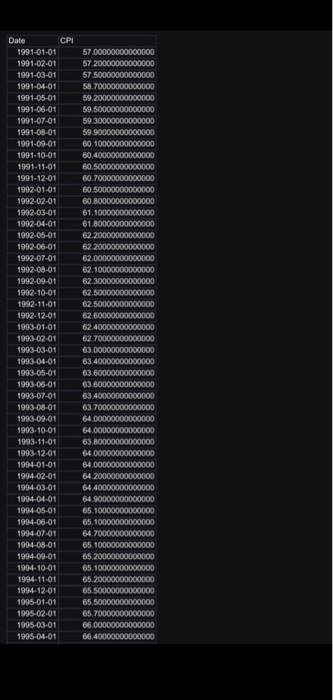
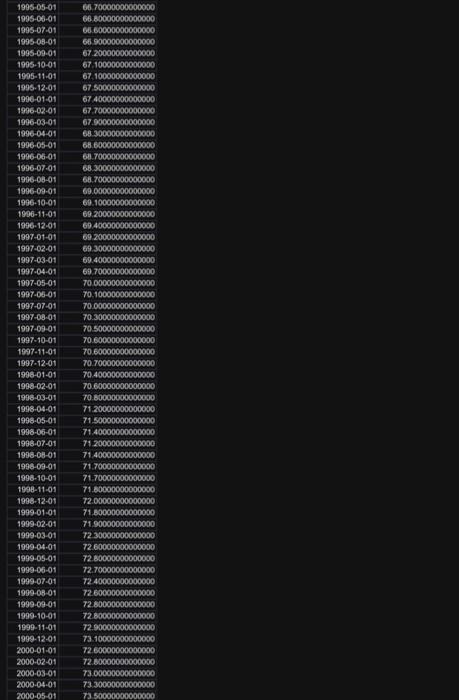
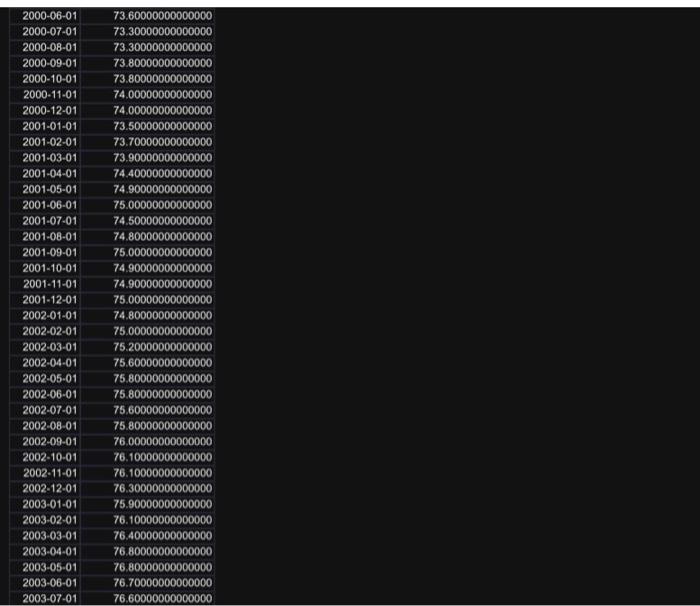
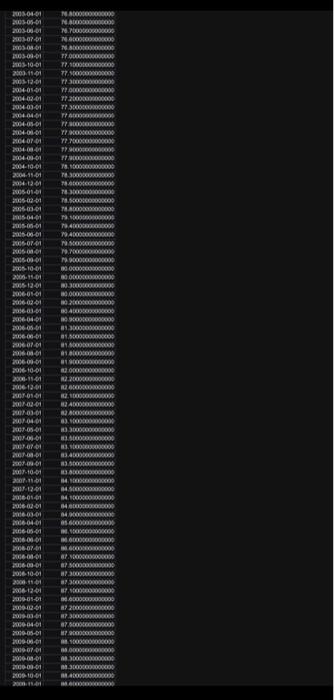
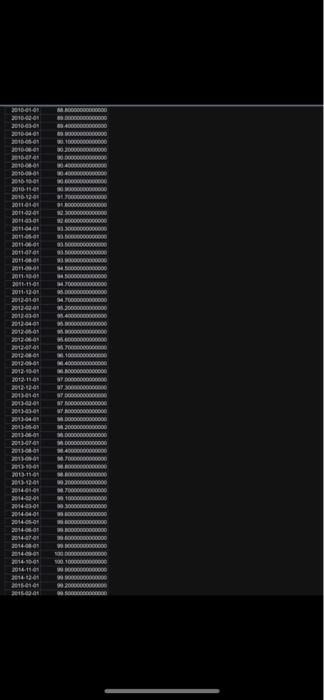
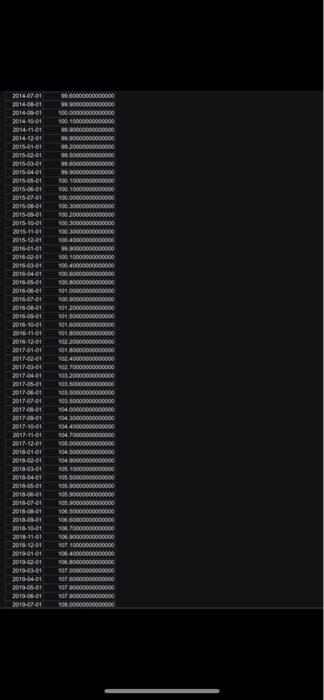
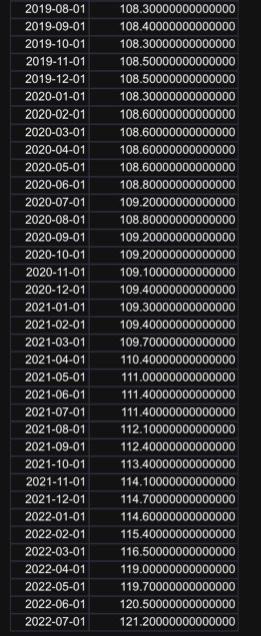
You are given monthly data of the U.K. Consumer Price Index (CPI) over the period 1991M1 to 2022M7. The data file name is CPI.xls, uploaded
You are given monthly data of the U.K. Consumer Price Index (CPI) over the period 1991M1 to 2022M7. The data file name is "CPI.xls", uploaded alongside this file (photos). First calculate the UK inflation rate, i.e., cpit= cpit -cpit-1, where cpit is the natural logarithm of the CPI at time t and is the first difference operator. Then:
a) Explain the Box-Jenkins approach in building an ARMA(p,q) model for cpit.
b) Use the full sample period to obtain a graph of the cpit series. Based on the graph, does the series appear to be stationary? Comment on the behaviour of this series over time.
c) Explain the terms autocorrelation function (ACF) and partial autocorrelation function (PACF). What shape would these two functions take for a stationary autoregressive process, a moving average process, and an autoregressive moving average process?
d) Obtain the autocorrelation function (ACF) and partial autocorrelation function (PACF) for the cpit series (specify the number of lags to be 6) using data from 1991M1 to 2020M12 (Note that this is not the full sample). Discuss the significance of the ACF and PACF coefficients and identify the suitable models that you would estimate.
e) Estimate all ARMA models from order (0, 0) to (6, 6) for the cpit series over the shorter sample period 1991M1 to 2020M12. From your estimations, which is the suitable model order? Explain why? (You would also need to report all relevant information for the models that you estimate, including the value of the AIC and SBIC and other relevant required criteria in a Table).
f) Re-estimate only the suitable model(s) identified from Question (e). Again, use only the sample 1991M1 to 2020M12. Report and comment on the results. Perform diagnostic checks on the residuals from these estimated model(s). Do the model(s) fit the data well?
g) Use the model(s) estimated in Question (f) to generate one step ahead (static) forecasts for the period 2021M1 2022M7. Create a graph of the actual cpit series and the forecasts that you have generated over the specified out-of-sample period. Comment on the results.
Conduct all your statistical tests at the 5% level.
Step by Step Solution
There are 3 Steps involved in it
Step: 1

Get Instant Access to Expert-Tailored Solutions
See step-by-step solutions with expert insights and AI powered tools for academic success
Step: 2

Step: 3
Ace Your Homework with AI
Get the answers you need in no time with our AI-driven, step-by-step assistance
Get Started
Financial Accounting
Authors: Jerry J. Weygandt, Paul D. Kimmel, Donald E. Kieso, J. Mather
8th Edition
0470929383, 978-0470929384