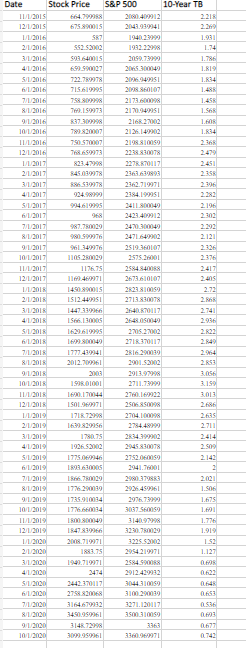
You are given monthly return data on Amazon (AMZN), S&P 500 index, and 10-year U.S. Government bonds, see attached. This data is obtained from https://finance.yahoo.com . Using regression analysis on the above data, you are asked to answer the questions below:
1. What is the estimate of Amazons levered beta (10 marks)? Show your regression results (dependent and independent variables, coefficient estimates, t-values, R2, etc.).
2. What is the estimate of Amazons unlevered beta (7 marks)? Amazons debt/equity ratio for 2021 was 1.073.
3. Using the above results in (a) and (b) and assuming that the historical estimates of the risk-free rate and the market risk premium in the U.S. capital markets are, respectively, 6% and 7%, and a corporate tax rate of 21%, calculate Amazons cost of equity capital (8 marks).
[ SOUTTES LC0065 669 MIT 19 201098 IC ( CUET WOO 1996 YET LITT SUT OSOIKEUNT Date Stock Price S&P 500 10-Year TB 11/1/2015 664.29 2080409912 2.213 12/1/2015 675.890015 2043.999941 22 1/1 2014 SR7 1.931 21, 2016 S52.5 2002 1982 1.74 3/1/2016 20:59.73999 1. 4/1/2016 2065 300049 1.R19 51.2016 722.79978 20969 1.834 6 1 2 715.610 1.48 7/1/2016 758.809998 2173.60008 1.450 8/1/2016 T.LS9973 2170947951 1.56 9121 R37309 216.2002 1.RO 101.2016 799.820007 21.26.49902 1.834 11/11/2016 790 970007 2199 810059 12/1.2016 7658659973 2238830078 823.42998 227.70417 2.451 2/1/2017 149.01978 2363639993 2.35 3/2011 86 539078 2362.710271 41 2017 924.99 2384.199951 2282 S/1/2017 994.619395 2411 800042 2.196 61. 2017 2423.409212 711.2013 987.70029 2420300040 8/11/2017 990 3471.649902 2.121 9/11/2017 . 2519.360107 101.2017 1105220020 2575.2001 2376 11/1/2017 11765 2584840088 12.1.2011 110.469971 2673.610107 2 1/1/2018 1490 890015 2.72 2/1/2018 IS12.4491SI 2713830078 2.6 3/1/2018 1447339766 264070117 2.741 41. 2018 1 Salons 2643.00049 2.936 S/1/2018 1629.612995 2705.2002 6/1/2018 1699 800049 271. 170117 2.4 7.2015 1771410141 2816200019 2.95 8/1/2018 2012.707361 2901.2002 91.2012 2003 29110 305 10120 190R000 2711.72999 3.159 11/1/2018 16:20.170044 276016222 3.013 12/1/2018 I SOL.969971 2506 SS 2.686 1/1/2019 171272298 2704.100098 2.3 2/1/2019 1699829956 2754.00 2.711 3/1/2019 178075 234399902 2414 41/2010 192 294510078 2.509 5/1/2019 2752.060059 2.143 61/2019 1893.630005 2941.76001 2 7/1/2019 166.70029 291 1798 2.001 &1.2010 1776.290030 2936.459361 1.50 91.2019 1735.910034 2976.73709 1.675 101201 17700014 3037560059 1. ] 11/11/2010 ROO 800049 314092998 1.776 12/1/2019 1047839966 3230780229 1.919 1/1/2000 2008.719971 3225.5.2002 1.53 21.220 181.75 2954.219971 1.121 3/1/2020 1942.710971 2584.2008 OHOR 41.2000 3474 2912.429932 51.2020 2442370117 3047310059 064 61.2000 2758820068 3100290039 06:53 71/2000 3164.679932 3271.120112 812020 349050361 3500 310059 912120 314R72998 3363 0621 101.2020 3099.90 3360.969971 0743 976090 SLLI 16 LOVU MISU E60 [ SOUTTES LC0065 669 MIT 19 201098 IC ( CUET WOO 1996 YET LITT SUT OSOIKEUNT Date Stock Price S&P 500 10-Year TB 11/1/2015 664.29 2080409912 2.213 12/1/2015 675.890015 2043.999941 22 1/1 2014 SR7 1.931 21, 2016 S52.5 2002 1982 1.74 3/1/2016 20:59.73999 1. 4/1/2016 2065 300049 1.R19 51.2016 722.79978 20969 1.834 6 1 2 715.610 1.48 7/1/2016 758.809998 2173.60008 1.450 8/1/2016 T.LS9973 2170947951 1.56 9121 R37309 216.2002 1.RO 101.2016 799.820007 21.26.49902 1.834 11/11/2016 790 970007 2199 810059 12/1.2016 7658659973 2238830078 823.42998 227.70417 2.451 2/1/2017 149.01978 2363639993 2.35 3/2011 86 539078 2362.710271 41 2017 924.99 2384.199951 2282 S/1/2017 994.619395 2411 800042 2.196 61. 2017 2423.409212 711.2013 987.70029 2420300040 8/11/2017 990 3471.649902 2.121 9/11/2017 . 2519.360107 101.2017 1105220020 2575.2001 2376 11/1/2017 11765 2584840088 12.1.2011 110.469971 2673.610107 2 1/1/2018 1490 890015 2.72 2/1/2018 IS12.4491SI 2713830078 2.6 3/1/2018 1447339766 264070117 2.741 41. 2018 1 Salons 2643.00049 2.936 S/1/2018 1629.612995 2705.2002 6/1/2018 1699 800049 271. 170117 2.4 7.2015 1771410141 2816200019 2.95 8/1/2018 2012.707361 2901.2002 91.2012 2003 29110 305 10120 190R000 2711.72999 3.159 11/1/2018 16:20.170044 276016222 3.013 12/1/2018 I SOL.969971 2506 SS 2.686 1/1/2019 171272298 2704.100098 2.3 2/1/2019 1699829956 2754.00 2.711 3/1/2019 178075 234399902 2414 41/2010 192 294510078 2.509 5/1/2019 2752.060059 2.143 61/2019 1893.630005 2941.76001 2 7/1/2019 166.70029 291 1798 2.001 &1.2010 1776.290030 2936.459361 1.50 91.2019 1735.910034 2976.73709 1.675 101201 17700014 3037560059 1. ] 11/11/2010 ROO 800049 314092998 1.776 12/1/2019 1047839966 3230780229 1.919 1/1/2000 2008.719971 3225.5.2002 1.53 21.220 181.75 2954.219971 1.121 3/1/2020 1942.710971 2584.2008 OHOR 41.2000 3474 2912.429932 51.2020 2442370117 3047310059 064 61.2000 2758820068 3100290039 06:53 71/2000 3164.679932 3271.120112 812020 349050361 3500 310059 912120 314R72998 3363 0621 101.2020 3099.90 3360.969971 0743 976090 SLLI 16 LOVU MISU E60