You are given the FastTrack of industry ID F112210; Answer the following questions explaining the reasons and justification for your answers; show your full calculations when needed.
(5 Points for each question)
- 1) a) Evaluate the Capital Structure of the company with the largest asset base. Comment on the results.
b) Calculate the leverage ratio of this company; is it a good leverage rate? Justify your answer.
2) What is Digby's overall competitive strategy? Justify your answer by explaining the company's functional decisions for each of its products in the R&D, Marketing and Production.
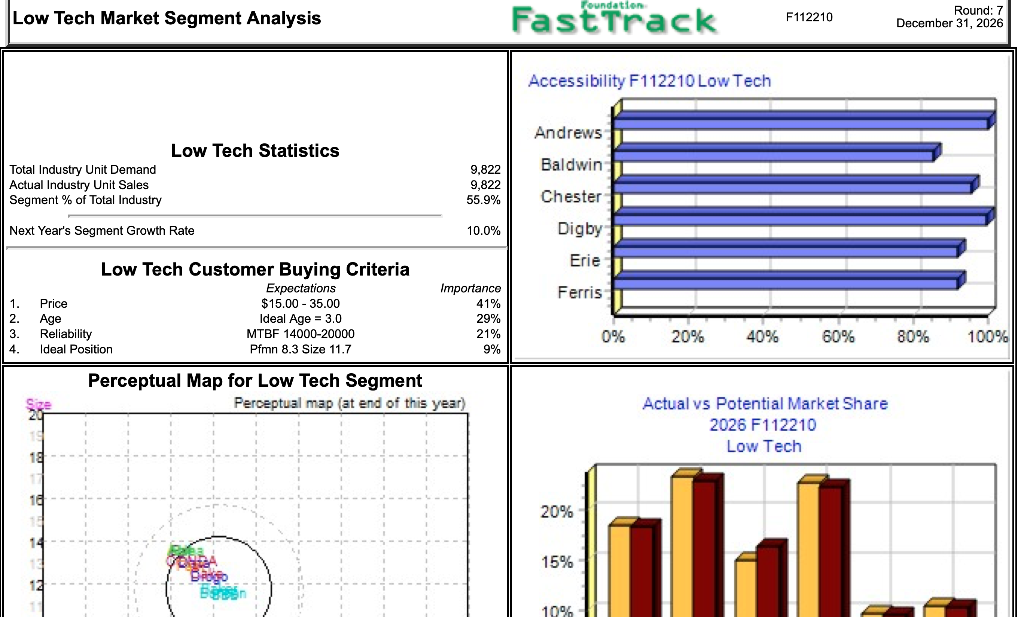
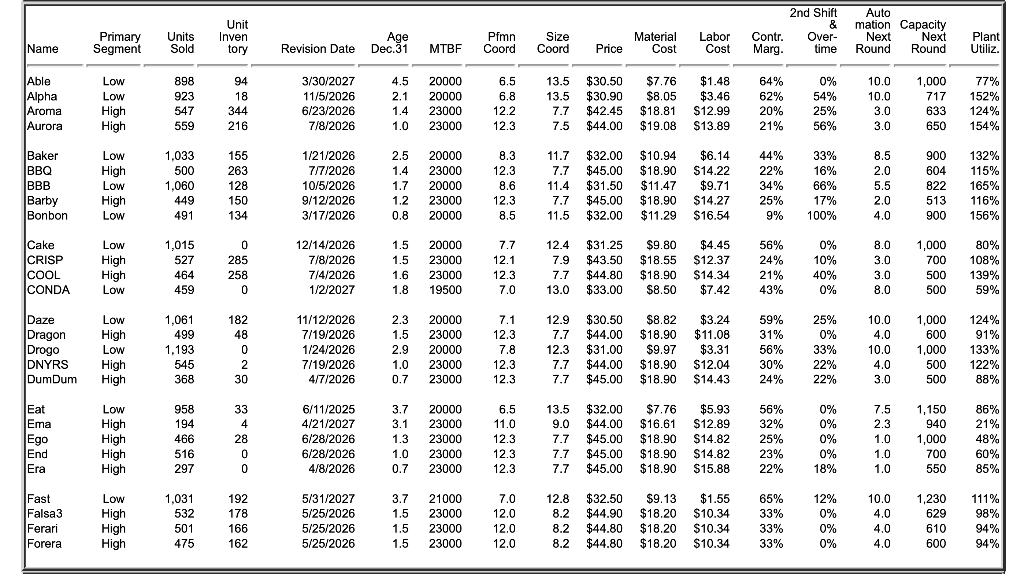
3) Calculate the quantity and value of lost sales for Chester's product CONDA, as well as Erie's product ERA.
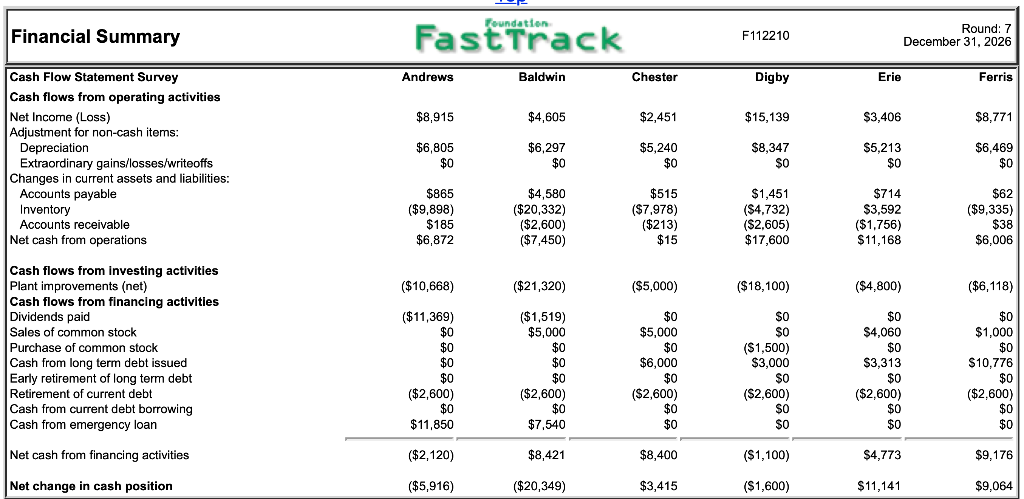
4) Why did company Andrew have an emergency loan worth $11850 despite the fact that it achieved a net profit of $8915?
5) What is the company that has the highest fixed cost percentage/sales? Justify your answers with calculations.
-
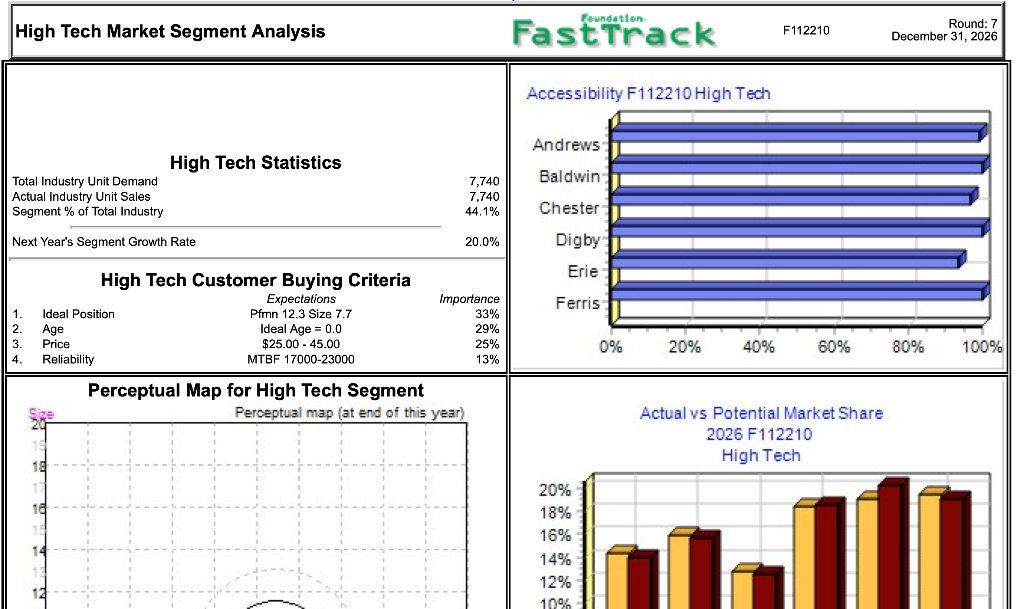
Foundation High Tech Market Segment Analysis Fast Track F112210 Round: 7 December 31, 2026 Accessibility F112210 High Tech Andrews Baldwin High Tech Statistics Total Industry Unit Demand Actual Industry Unit Sales Segment % of Total Industry 7,740 7.740 44.1% Next Year's Segment Growth Rate 20.0% Chester Digby Erie Ferris 1. 2. 3. 4. High Tech Customer Buying Criteria Expectations Ideal Position Pfmn 12.3 Size 7.7 Age Ideal Age = 0.0 Price $25.00 - 45.00 Reliability MTBF 17000-23000 Importance 33% 29% 25% 13% 0% 20% 40% 60% 80% 100% Perceptual Map for High Tech Segment Perceptual map (at end of this year) Actual vs Potential Market Share 2026 F112210 High Tech 20% 18% 16% 14% 12% 10% Foundation Financial Summary Fast Track F112210 Round: 7 December 31, 2026 Andrews Baldwin Chester Digby Erie Ferris $8,915 $4,605 $2,451 $15,139 $3,406 $8,771 Cash Flow Statement Survey Cash flows from operating activities Net Income (Loss) Adjustment for non-cash items: Depreciation Extraordinary gains/losses/writeoffs Changes in current assets and liabilities: Accounts payable Inventory Accounts receivable Net cash from operations $6,805 $0 $6,297 $0 $5,240 $0 $8,347 $0 $5,213 $0 $6,469 $0 $865 ($9,898) $185 $6,872 $4,580 ($20,332) ($2,600) ($7,450) $515 ($7.978) ($213) $15 $1,451 ($4,732) ($2,605) $714 $3,592 ($1,756) $11,168 $62 ($9,335) $38 $6,006 $17,600 ($10,668) ($21,320) ($5,000) ($18,100) ($4,800) ($6,118) Cash flows from investing activities Plant improvements (net) Cash flows from financing activities Dividends paid Sales of common stock Purchase of common stock Cash from long term debt issued Early retirement of long term debt Retirement of current debt Cash from current debt borrowing Cash from emergency loan ($11,369) $0 $0 $0 $0 ($2,600) $0 $11,850 ($1,519) $5,000 $0 $0 $0 ($2,600) $0 $7,540 $0 $5,000 $0 $6,000 $0 ($2,600) $0 $0 SO $O ($1,500) $3,000 $0 ($2,600) $0 $0 $0 $4,060 $0 $3,313 $0 $0 $1,000 $0 $10,776 $0 ($2,600) $0 $0 ($2,600) $0 $0 Net cash from financing activities ($2,120) $8,421 $8,400 ($1,100) $4,773 $9,176 Net change in cash position ($5,916) ($20,349) $3,415 ($1,600) $11,141 $9,064 Foundation Low Tech Market Segment Analysis Fast Track F112210 Round: 7 December 31, 2026 Accessibility F112210 Low Tech Andrews Low Tech Statistics Baldwin Total Industry Unit Demand Actual Industry Unit Sales Segment % of Total Industry 9.822 9,822 55.9% Chester Next Year's Segment Growth Rate 10.0% Digby Erie Ferris 1 Low Tech Customer Buying Criteria Expectations Price $15.00 - 35.00 Age Ideal Age = 3.0 Reliability MTBF 14000-20000 Ideal Position Pfmn 8.3 Size 11.7 2. 3 4 Importance 41% 29% 21% 9% 0% 20% 40% 60% 80% 100% Perceptual Map for Low Tech Segment Perceptual map (at end of this year) Actual vs Potential Market Share 2026 F112210 Low Tech 20% al 15% 10% Size Unit Inven tory Primary Segment Units Sold Name Age Dec.31 2nd Shift & Contr. Over- Marg. time Pfmn Coord Revision Date Auto mation Capacity Next Next Round Round Material Cost MTBF Coord Labor Cost Price Plant Utiliz Able Alpha Aroma Aurora Low Low High High 898 923 547 559 94 18 344 216 3/30/2027 11/5/2026 6/23/2026 7/8/2026 4.5 2.1 1.4 1.0 20000 20000 23000 23000 6.5 6.8 12.2 12.3 13.5 13.5 7.7 7.5 $30.50 $30.90 $42.45 $44.00 $7.76 $8.05 $18.81 $19.08 $1.48 $3.46 S12.99 $13.89 64% 62% 20% 21% 0% 54% 25% 56% 10.0 10.0 3.0 3.0 1,000 717 633 650 77% 152% 124% 154% Baker BBQ 1,033 500 Low High Low High Low BBB 155 263 128 150 134 2.5 1.4 1.7 1.060 1/21/2026 7/7/2026 10/5/2026 9/12/2026 3/17/2026 20000 23000 20000 23000 20000 8.3 12.3 8.6 12.3 8.5 11.7 7.7 11.4 7.7 11.5 $32.00 $45.00 $31.50 $45.00 $32.00 $10.94 $18.90 $11.47 $18.90 $11.29 $6.14 $14.22 $9.71 $14.27 $16.54 44% 22% 34% 25% 9% 33% 16% 66% 17% 100% 8.5 2.0 5.5 2.0 4.0 900 604 822 513 900 132% 115% 165% 116% 156% 1.2 Barby Bonbon 449 491 0.8 Cake CRISP COOL CONDA Low High High Low 1,015 527 464 459 0 285 258 0 12/14/2026 7/8/2026 7/4/2026 1/2/2027 1.5 1.5 1.6 1.8 20000 23000 23000 19500 7.7 12.1 12.3 7.0 12.4 7.9 7.7 13.0 $31.25 $43.50 $44.80 $33.00 $9.80 $18.55 $18.90 $8.50 $4.45 $12.37 $14.34 $7.42 56% 24% 21% 43% 0% 10% 40% 0% 8.0 3.0 3.0 8.0 1,000 700 500 500 80% 108% 139% 59% Daze Dragon Drogo DNYRS Dum Dum Low High Low High High 1,061 499 1,193 545 368 182 48 0 2 30 11/12/2026 7/19/2026 1/24/2026 7/19/2026 4/7/2026 2.3 1.5 2.9 1.0 0.7 20000 23000 20000 23000 23000 7.1 12.3 7.8 12.3 12.3 12.9 7.7 12.3 7.7 7.7 $30.50 $44.00 $31.00 $44.00 $45.00 $8.82 $18.90 $9.97 $18.90 $18.90 $3.24 $11.08 $3.31 S12.04 $14.43 59% 31% 56% 30% 24% 25% 0% 33% 22% 22% 10.0 4.0 10.0 4.0 3.0 1,000 600 1,000 500 500 124% 91% 133% 122% 88% Eat Ema Ego End Era Low High High High High 958 194 466 516 297 33 4 28 0 0 6/11/2025 4/21/2027 6/28/2026 6/28/2026 4/8/2026 3.7 3.1 1.3 1.0 0.7 20000 23000 23000 23000 23000 6.5 11.0 12.3 12.3 12.3 13.5 9.0 7.7 7.7 7.7 $32.00 $44.00 $45.00 $45.00 $45.00 $7.76 $16.61 $18.90 $18.90 $18.90 $5.93 $12.89 $14.82 $14.82 S15.88 56% 32% 25% 23% 22% 0% 0% 0% 0% 18% 7.5 2.3 1.0 1.0 1.0 1,150 940 1,000 700 550 86% 21% 48% 60% 85% Fast Falsa3 Ferari Forera Low High High High 1,031 532 501 475 192 178 166 162 5/31/2027 5/25/2026 5/25/2026 5/25/2026 3.7 1.5 1.5 1.5 21000 23000 23000 23000 7.0 12.0 12.0 12.0 12.8 8.2 8.2 8.2 $32.50 $44.90 $44.80 $44.80 $9.13 $18.20 $18.20 $18.20 $1.55 $10.34 $10.34 $10.34 65% 33% 33% 33% 12% 0% 0% 0% 10.0 4.0 4.0 4.0 1,230 629 610 600 111% 98% 94% 94% Foundation High Tech Market Segment Analysis Fast Track F112210 Round: 7 December 31, 2026 Accessibility F112210 High Tech Andrews Baldwin High Tech Statistics Total Industry Unit Demand Actual Industry Unit Sales Segment % of Total Industry 7,740 7.740 44.1% Next Year's Segment Growth Rate 20.0% Chester Digby Erie Ferris 1. 2. 3. 4. High Tech Customer Buying Criteria Expectations Ideal Position Pfmn 12.3 Size 7.7 Age Ideal Age = 0.0 Price $25.00 - 45.00 Reliability MTBF 17000-23000 Importance 33% 29% 25% 13% 0% 20% 40% 60% 80% 100% Perceptual Map for High Tech Segment Perceptual map (at end of this year) Actual vs Potential Market Share 2026 F112210 High Tech 20% 18% 16% 14% 12% 10% Foundation Financial Summary Fast Track F112210 Round: 7 December 31, 2026 Andrews Baldwin Chester Digby Erie Ferris $8,915 $4,605 $2,451 $15,139 $3,406 $8,771 Cash Flow Statement Survey Cash flows from operating activities Net Income (Loss) Adjustment for non-cash items: Depreciation Extraordinary gains/losses/writeoffs Changes in current assets and liabilities: Accounts payable Inventory Accounts receivable Net cash from operations $6,805 $0 $6,297 $0 $5,240 $0 $8,347 $0 $5,213 $0 $6,469 $0 $865 ($9,898) $185 $6,872 $4,580 ($20,332) ($2,600) ($7,450) $515 ($7.978) ($213) $15 $1,451 ($4,732) ($2,605) $714 $3,592 ($1,756) $11,168 $62 ($9,335) $38 $6,006 $17,600 ($10,668) ($21,320) ($5,000) ($18,100) ($4,800) ($6,118) Cash flows from investing activities Plant improvements (net) Cash flows from financing activities Dividends paid Sales of common stock Purchase of common stock Cash from long term debt issued Early retirement of long term debt Retirement of current debt Cash from current debt borrowing Cash from emergency loan ($11,369) $0 $0 $0 $0 ($2,600) $0 $11,850 ($1,519) $5,000 $0 $0 $0 ($2,600) $0 $7,540 $0 $5,000 $0 $6,000 $0 ($2,600) $0 $0 SO $O ($1,500) $3,000 $0 ($2,600) $0 $0 $0 $4,060 $0 $3,313 $0 $0 $1,000 $0 $10,776 $0 ($2,600) $0 $0 ($2,600) $0 $0 Net cash from financing activities ($2,120) $8,421 $8,400 ($1,100) $4,773 $9,176 Net change in cash position ($5,916) ($20,349) $3,415 ($1,600) $11,141 $9,064 Foundation Low Tech Market Segment Analysis Fast Track F112210 Round: 7 December 31, 2026 Accessibility F112210 Low Tech Andrews Low Tech Statistics Baldwin Total Industry Unit Demand Actual Industry Unit Sales Segment % of Total Industry 9.822 9,822 55.9% Chester Next Year's Segment Growth Rate 10.0% Digby Erie Ferris 1 Low Tech Customer Buying Criteria Expectations Price $15.00 - 35.00 Age Ideal Age = 3.0 Reliability MTBF 14000-20000 Ideal Position Pfmn 8.3 Size 11.7 2. 3 4 Importance 41% 29% 21% 9% 0% 20% 40% 60% 80% 100% Perceptual Map for Low Tech Segment Perceptual map (at end of this year) Actual vs Potential Market Share 2026 F112210 Low Tech 20% al 15% 10% Size Unit Inven tory Primary Segment Units Sold Name Age Dec.31 2nd Shift & Contr. Over- Marg. time Pfmn Coord Revision Date Auto mation Capacity Next Next Round Round Material Cost MTBF Coord Labor Cost Price Plant Utiliz Able Alpha Aroma Aurora Low Low High High 898 923 547 559 94 18 344 216 3/30/2027 11/5/2026 6/23/2026 7/8/2026 4.5 2.1 1.4 1.0 20000 20000 23000 23000 6.5 6.8 12.2 12.3 13.5 13.5 7.7 7.5 $30.50 $30.90 $42.45 $44.00 $7.76 $8.05 $18.81 $19.08 $1.48 $3.46 S12.99 $13.89 64% 62% 20% 21% 0% 54% 25% 56% 10.0 10.0 3.0 3.0 1,000 717 633 650 77% 152% 124% 154% Baker BBQ 1,033 500 Low High Low High Low BBB 155 263 128 150 134 2.5 1.4 1.7 1.060 1/21/2026 7/7/2026 10/5/2026 9/12/2026 3/17/2026 20000 23000 20000 23000 20000 8.3 12.3 8.6 12.3 8.5 11.7 7.7 11.4 7.7 11.5 $32.00 $45.00 $31.50 $45.00 $32.00 $10.94 $18.90 $11.47 $18.90 $11.29 $6.14 $14.22 $9.71 $14.27 $16.54 44% 22% 34% 25% 9% 33% 16% 66% 17% 100% 8.5 2.0 5.5 2.0 4.0 900 604 822 513 900 132% 115% 165% 116% 156% 1.2 Barby Bonbon 449 491 0.8 Cake CRISP COOL CONDA Low High High Low 1,015 527 464 459 0 285 258 0 12/14/2026 7/8/2026 7/4/2026 1/2/2027 1.5 1.5 1.6 1.8 20000 23000 23000 19500 7.7 12.1 12.3 7.0 12.4 7.9 7.7 13.0 $31.25 $43.50 $44.80 $33.00 $9.80 $18.55 $18.90 $8.50 $4.45 $12.37 $14.34 $7.42 56% 24% 21% 43% 0% 10% 40% 0% 8.0 3.0 3.0 8.0 1,000 700 500 500 80% 108% 139% 59% Daze Dragon Drogo DNYRS Dum Dum Low High Low High High 1,061 499 1,193 545 368 182 48 0 2 30 11/12/2026 7/19/2026 1/24/2026 7/19/2026 4/7/2026 2.3 1.5 2.9 1.0 0.7 20000 23000 20000 23000 23000 7.1 12.3 7.8 12.3 12.3 12.9 7.7 12.3 7.7 7.7 $30.50 $44.00 $31.00 $44.00 $45.00 $8.82 $18.90 $9.97 $18.90 $18.90 $3.24 $11.08 $3.31 S12.04 $14.43 59% 31% 56% 30% 24% 25% 0% 33% 22% 22% 10.0 4.0 10.0 4.0 3.0 1,000 600 1,000 500 500 124% 91% 133% 122% 88% Eat Ema Ego End Era Low High High High High 958 194 466 516 297 33 4 28 0 0 6/11/2025 4/21/2027 6/28/2026 6/28/2026 4/8/2026 3.7 3.1 1.3 1.0 0.7 20000 23000 23000 23000 23000 6.5 11.0 12.3 12.3 12.3 13.5 9.0 7.7 7.7 7.7 $32.00 $44.00 $45.00 $45.00 $45.00 $7.76 $16.61 $18.90 $18.90 $18.90 $5.93 $12.89 $14.82 $14.82 S15.88 56% 32% 25% 23% 22% 0% 0% 0% 0% 18% 7.5 2.3 1.0 1.0 1.0 1,150 940 1,000 700 550 86% 21% 48% 60% 85% Fast Falsa3 Ferari Forera Low High High High 1,031 532 501 475 192 178 166 162 5/31/2027 5/25/2026 5/25/2026 5/25/2026 3.7 1.5 1.5 1.5 21000 23000 23000 23000 7.0 12.0 12.0 12.0 12.8 8.2 8.2 8.2 $32.50 $44.90 $44.80 $44.80 $9.13 $18.20 $18.20 $18.20 $1.55 $10.34 $10.34 $10.34 65% 33% 33% 33% 12% 0% 0% 0% 10.0 4.0 4.0 4.0 1,230 629 610 600 111% 98% 94% 94%