

Question
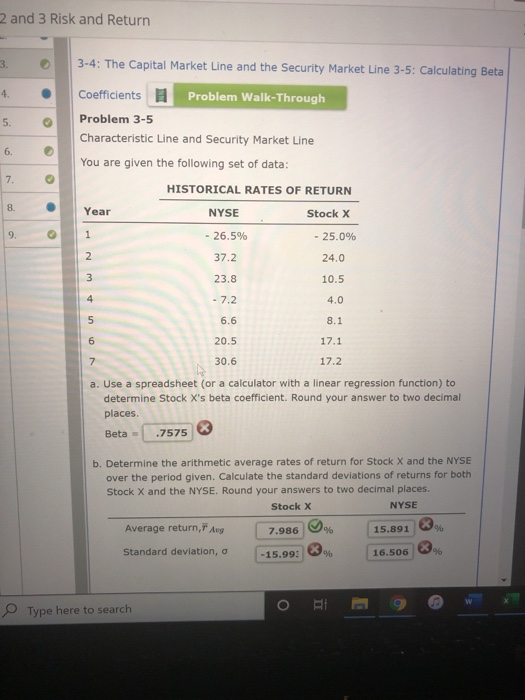
You are given the following set of data: HISTORICAL RATES OF RETURN Year NYSE Stock X 1 - 26.5% - 25.0% 2 37.2 24.0 3
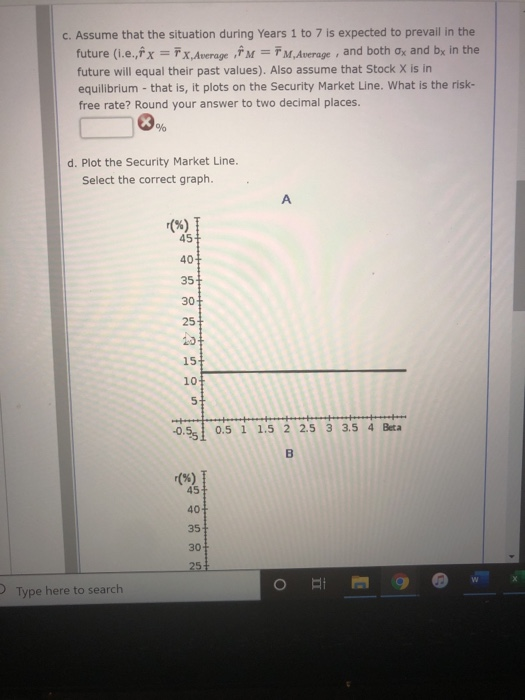
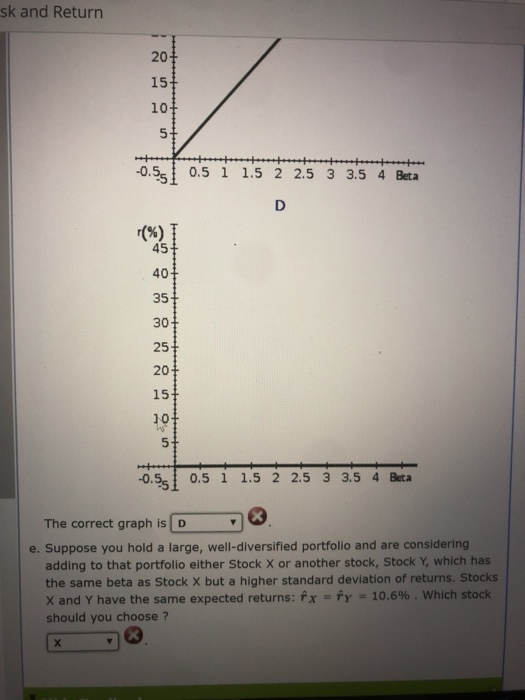
You are given the following set of data: HISTORICAL RATES OF RETURN Year NYSE Stock X 1 - 26.5% - 25.0% 2 37.2 24.0 3 23.8 10.5 4 - 7.2 4.0 5 6.6 8.1 6 20.5 17.1 7 30.6 17.2 Use a spreadsheet (or a calculator with a linear regression function) to determine Stock X's beta coefficient. Round your answer to two decimal places. Beta = Determine the arithmetic average rates of return for Stock X and the NYSE over the period given. Calculate the standard deviations of returns for both Stock X and the NYSE. Round your answers to two decimal places. Stock X NYSE Average return, % % Standard deviation, % % Assume that the situation during Years 1 to 7 is expected to prevail in the future (i.e., , , and both x and bx in the future will equal their past values). Also assume that Stock X is in equilibrium - that is, it plots on the Security Market Line. What is the risk-free rate? Round your answer to two decimal places. % Plot the Security Market Line. Select the correct graph. The correct graph is . Suppose you hold a large, well-diversified portfolio and are considering adding to that portfolio either Stock X or another stock, Stock Y, which has the same beta as Stock X but a higher standard deviation of returns. Stocks X and Y have the same expected returns: = = 10.6% . Which stock should you choose ?
Step by Step Solution
There are 3 Steps involved in it
Step: 1

Get Instant Access to Expert-Tailored Solutions
See step-by-step solutions with expert insights and AI powered tools for academic success
Step: 2

Step: 3
Ace Your Homework with AI
Get the answers you need in no time with our AI-driven, step-by-step assistance
Get Started
Financial Valuation
Authors: James R. Hitchner
4th Edition
1119286603, 978-1119286608