

Answered step by step
Verified Expert Solution
Question
1 Approved Answer
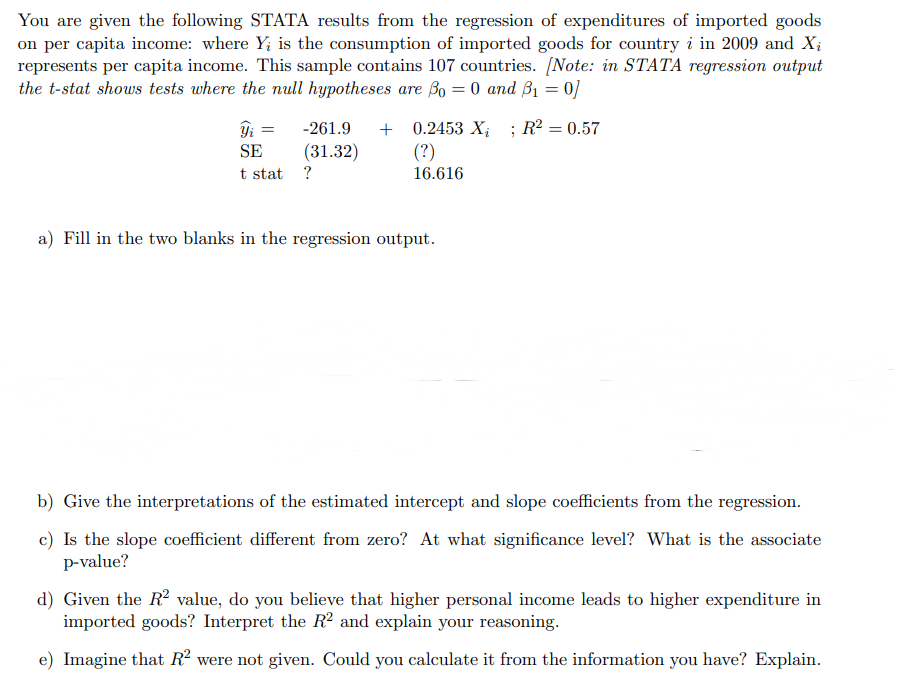
You are given the following STATA results from the regression of expenditures of imported goods on per capita income: where Yr is the consumption of
Step by Step Solution
There are 3 Steps involved in it
Step: 1

Get Instant Access to Expert-Tailored Solutions
See step-by-step solutions with expert insights and AI powered tools for academic success
Step: 2

Step: 3
Ace Your Homework with AI
Get the answers you need in no time with our AI-driven, step-by-step assistance
Get Started
Simulation
Authors: Sheldon M Ross
6th Edition
0323899617, 9780323899611