Answered step by step
Verified Expert Solution
Link Copied!

Question

1 Approved Answer

You are going to use data of a sample of stock returns from the table below to do calculations for the next six MCQ's. You
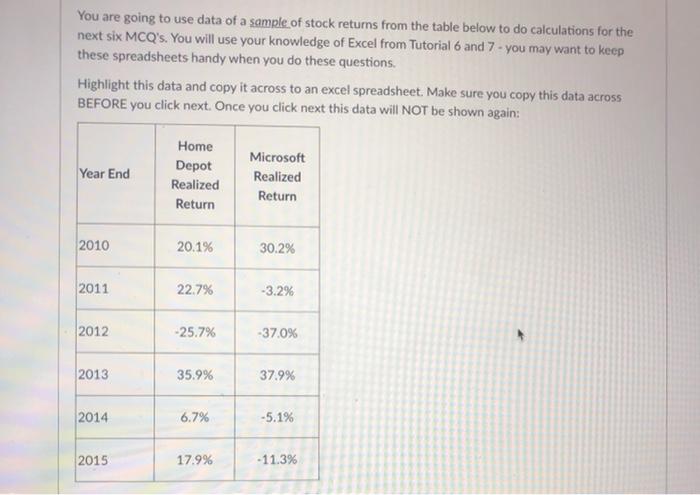
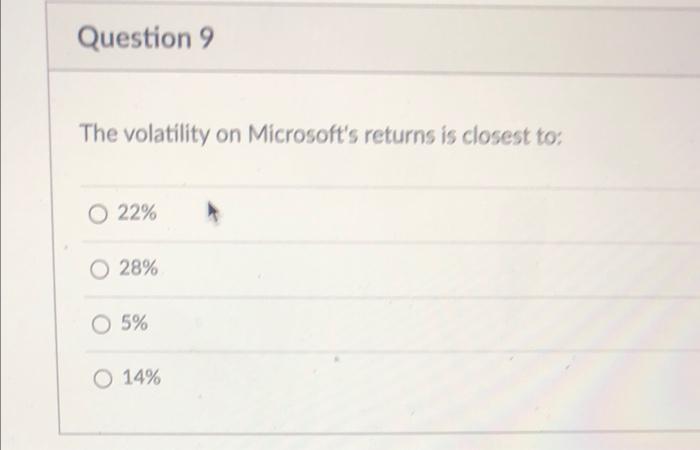
image text in transcribed
You are going to use data of a sample of stock returns from the table below to do calculations for the next six MCQ's. You will use your knowledge of Excel from Tutorial 6 and 7 - you may want to keep these spreadsheets handy when you do these questions. Highlight this data and copy it across to an excel spreadsheet. Make sure you copy this data across BEFORE you click next. Once you click next this data will NOT be shown again: Year End Home Depot Realized Return Microsoft Realized Return 2010 20.1% 30.2% 2011 22.7% -3.2% 2012 -25.7% -37.0% 2013 35.9% 37.9% 2014 6.7% -5.1% 2015 17.9% - 11.3% Question 9 The volatility on Microsoft's returns is closest to: O 22% 0 28% O 5% O 14%

Step by Step Solution

There are 3 Steps involved in it

Step: 1

blur-text-image

Get Instant Access to Expert-Tailored Solutions

See step-by-step solutions with expert insights and AI powered tools for academic success

Step: 2

blur-text-image_2

Step: 3

blur-text-image_3

Ace Your Homework with AI

Get the answers you need in no time with our AI-driven, step-by-step assistance

Get Started

Recommended Textbook for

Smart Supply Chain Finance

Authors: Hua Song

1st Edition

9811659966, 978-9811659966

More Books

Students also viewed these Finance questions

Question

What other requirements do they have for admission?

Answered: 1 week ago

Question

1. Define and explain culture and its impact on your communication

Answered: 1 week ago