

Answered step by step
Verified Expert Solution
Question
1 Approved Answer
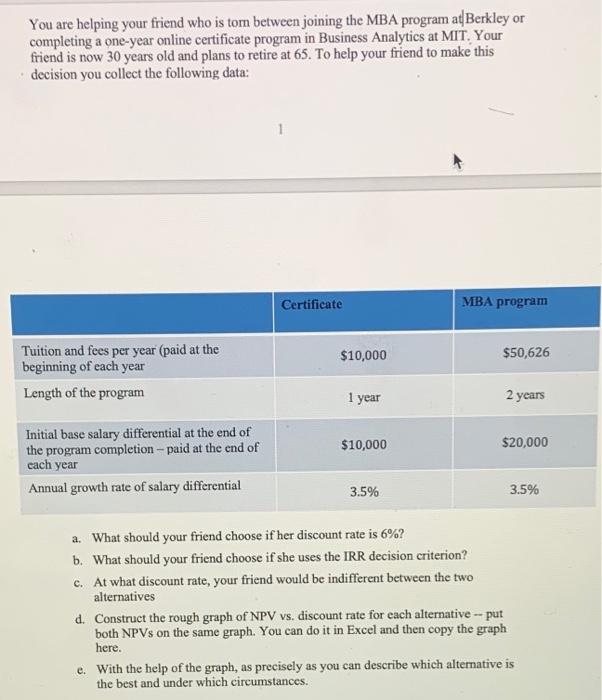
You are helping your friend who is torn between joining the MBA program at Berkley or completing a one-year online certificate program in Business Analytics
Step by Step Solution
There are 3 Steps involved in it
Step: 1

Get Instant Access to Expert-Tailored Solutions
See step-by-step solutions with expert insights and AI powered tools for academic success
Step: 2

Step: 3
Ace Your Homework with AI
Get the answers you need in no time with our AI-driven, step-by-step assistance
Get Started
Banking Reforms And Monetary Policy In The Peoples Republic Of China
Authors: Yong Guo
1st Edition
1403900787,1403914540