Answered step by step
Verified Expert Solution
Question
1 Approved Answer
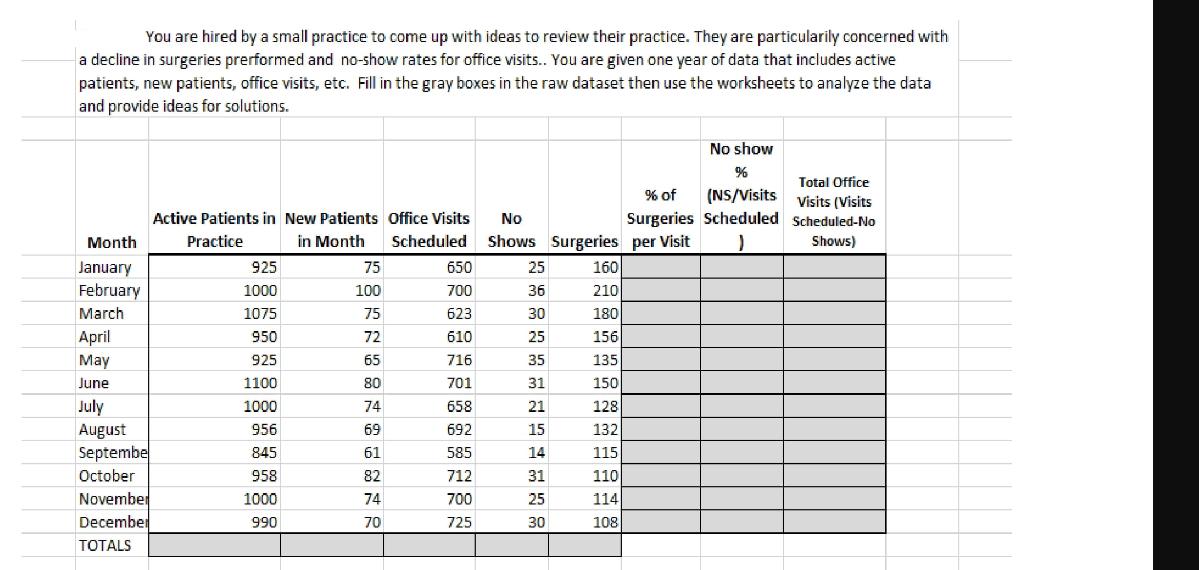
You are hired by a small practice to come up with ideas to review their practice. They are particularily concerned with a decline in


You are hired by a small practice to come up with ideas to review their practice. They are particularily concerned with a decline in surgeries prerformed and no-show rates for office visits.. You are given one year of data that includes active patients, new patients, office visits, etc. Fill in the gray boxes in the raw dataset then use the worksheets to analyze the data and provide ideas for solutions. No show % Active Patients in New Patients Office Visits No Month Practice in Month (NS/Visits Visits (Visits Surgeries Scheduled Scheduled-No Scheduled Shows Surgeries per Visit Shows) Total Office % of January 925 75 650 25 160 February 1000 100 700 36 210 March 1075 75 623 30 180 April 950 72 610 25 156 May 925 65 716 35 135 June 1100 80 701 31 150 July 1000 74 658 21 128 August 956 69 692 15 132 Septembe 845 61 585 14 115 October 958 82 712 31 110 November 1000 74 700 25 114 December 990 70 725 30 108 TOTALS ASSIGNMENT 1) ON THIS TAB/SHEET: Complete calculations in gray cells 2)ON SECOND TAB-GRAPHS - Use at least two diffent styles of graphs to depict: 1) Number of Active patients per month 2) Number of New Patients per month 3) Surgery/Visit Ratio Trend line 4) No Show Rate -- Trend line 31 ON TAB 3 (Discussion Analytics) Analyze the data by providing 4 bullet/talking points
Step by Step Solution
There are 3 Steps involved in it
Step: 1
Here are the calculations for the gray cells No show NSVisits Scheduled January 2565...
Get Instant Access to Expert-Tailored Solutions
See step-by-step solutions with expert insights and AI powered tools for academic success
Step: 2

Step: 3

Ace Your Homework with AI
Get the answers you need in no time with our AI-driven, step-by-step assistance
Get Started


