Answered step by step
Verified Expert Solution
Question
1 Approved Answer
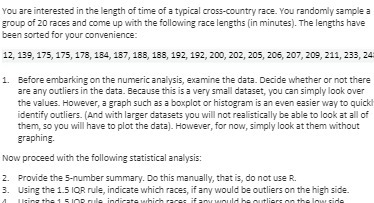
You are interested in the length of time of a typical cross-country race. You randomly sample a group of 20 races and come up

You are interested in the length of time of a typical cross-country race. You randomly sample a group of 20 races and come up with the following race lengths (in minutes). The lengths have been sorted for your convenience: 12, 139, 175, 175, 178, 184, 187, 188, 188, 192, 192, 200, 202, 205, 206, 207, 209, 211, 233, 24 1. Before embarking on the numeric analysis, examine the data. Decide whether or not there are any outliers in the data. Because this is a very small dataset, you can simply look over the values. However, a graph such as a boxplot or histogram is an even easier way to quick! identify outliers. (And with larger datasets you will not realistically be able to look at all of them, so you will have to plot the data). However, for now, simply look at them without graphing. Now proceed with the following statistical analysis: 2. Provide the 5-number summary. Do this manually, that is, do not use R. 3. Using the 1.5 IQR rule, indicate which races, if any would be outliers on the high side. A Using the 15 JOR nule indicate which races if any would be outliers on the low side
Step by Step Solution
There are 3 Steps involved in it
Step: 1

Get Instant Access to Expert-Tailored Solutions
See step-by-step solutions with expert insights and AI powered tools for academic success
Step: 2

Step: 3

Ace Your Homework with AI
Get the answers you need in no time with our AI-driven, step-by-step assistance
Get Started


